
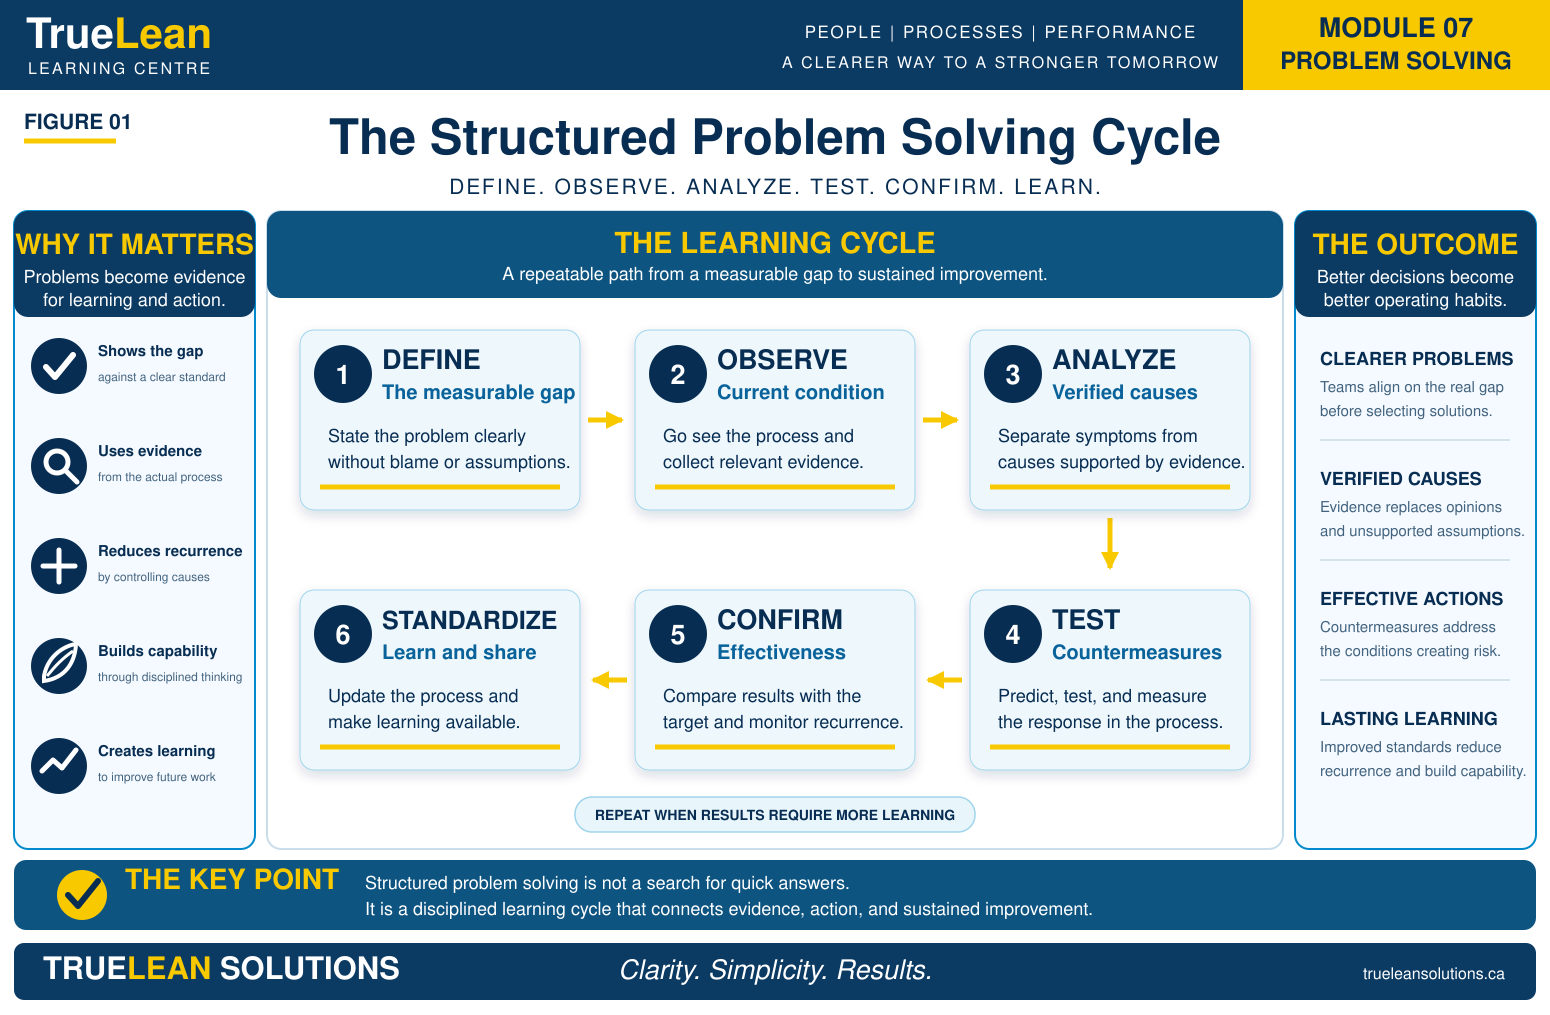
Structured problem solving turns recurring reaction into disciplined learning. It protects the customer while teams define the gap, observe the work, verify causes, test countermeasures and sustain improved performance.
01 • Learning Objectives
Structured problem solving converts abnormalities into evidence, learning, corrective action, and sustained performance. It protects the customer while helping teams understand and improve the process conditions that produced the gap.
Define a problem as the measurable gap between expected and actual performance.
Distinguish containment, correction, corrective action, and continuous improvement.
Observe the current condition and separate evidence from assumptions.
Use Five Whys and cause and effect analysis without forcing a predetermined answer.
Apply PDCA as a learning cycle and understand A3 as a management and coaching process.
Select countermeasures that connect directly to verified causes.
Confirm effectiveness, monitor recurrence, and incorporate learning into standard work.
Recognize leadership behaviours that make problems visible and strengthen capability.
The goal is not to close actions quickly. The goal is to understand the performance gap, control risk, verify causes, and improve the conditions that allowed the problem to occur.
02 • What Structured Problem Solving Means
A problem is a measurable difference between the expected condition and the actual condition. Structured problem solving provides a disciplined method for understanding that difference before selecting a response.
A practical learning sequence
Recognize the abnormal condition.
Protect the customer and control immediate risk.
Define the performance gap.
Observe the work and understand the current condition.
Collect and stratify relevant evidence.
Identify possible causes.
Verify the causes that materially influence the problem.
Select and test countermeasures.
Confirm results and monitor recurrence.
Standardize the improvement and share learning.
Methods such as PDCA, A3, 8D, DMAIC, Five Whys, and cause and effect analysis organize different parts of this work. None of them eliminates the need for observation, judgement, evidence, and follow up.
Match the method to the problem
TrueLean does not begin with a preferred tool. The starting point is the operational condition: the immediate risk, size of the gap, available evidence, level of complexity, and response the organization requires.
| Operational condition | What the work requires | Best-fit starting point |
|---|---|---|
| Localized performance gap | Rapid testing and learning close to the work | PDCA or Practical Problem Solving |
| Customer-impacting quality failure | Immediate containment and a documented cross-functional response | 8D |
| Chronic variation supported by reliable data | Measurement, statistical analysis, and process control | DMAIC |
| Complex issue requiring leadership alignment | Visible thinking, coaching, ownership, and structured communication | A3 Thinking |
| Several possible causal paths | Organized cause exploration followed by evidence-based verification | Fishbone and Five Whys |
| Immediate safety, quality, or delivery risk | Protect people and customers before beginning deeper analysis | Containment and escalation first |
Method selection is not a substitute for disciplined thinking. Fishbone and Five Whys are supporting analysis tools that may be used within PDCA, A3, 8D, or DMAIC. As evidence develops, the scope and method may also need to change.
Structured problem solving slows the rush to a solution long enough to improve the quality of the decision.
03 • Define the Problem Before Solving It
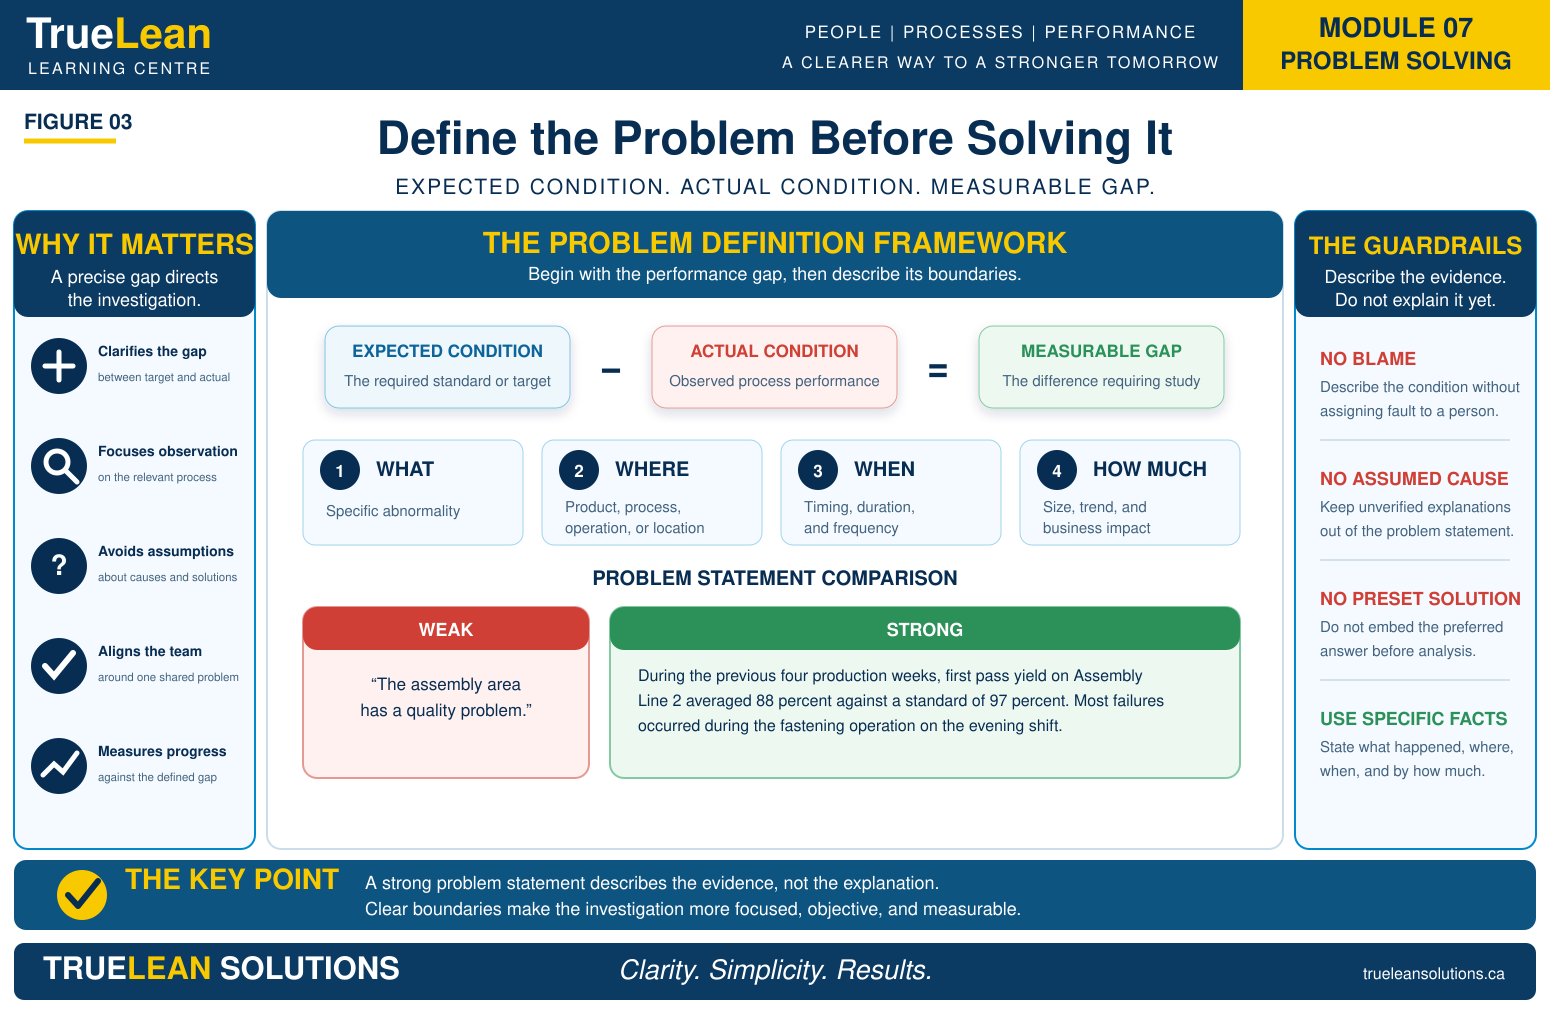
A strong problem statement describes what happened, where it occurred, when it occurred, how often it occurred, and how large the gap is. It does not assign blame, assume a cause, or embed a preferred solution.
Expected condition, actual condition, and measurable gap
| Element | Question |
|---|---|
| Expected condition | What should happen under the defined requirement or standard? |
| Actual condition | What is happening now, based on direct observation and reliable data? |
| Measurable gap | How large is the difference, where is it concentrated, and what is the impact? |
Weak and strong problem statements
Weak: The assembly area has a quality problem.
Strong: During the previous four production weeks, First Pass Yield on Assembly Line 2 averaged 88 percent against a standard of 97 percent. Most failures occurred during the fastening operation on the evening shift.
The strong statement narrows the investigation without claiming why the failures occurred. It creates a shared starting point and makes the required improvement visible.
04 • Understand the Current Condition
Direct observation connects the data with the way the work is actually performed. The team should compare the defined method with the actual sequence, material and information flow, process settings, equipment condition, visual controls, abnormality response, and known workarounds.
Stratify the evidence
| Dimension | Examples |
|---|---|
| Time | Hour, day, week, season, start up, changeover |
| Location | Line, machine, cavity, station, supplier, customer |
| Product | Model, family, option, material lot, configuration |
| People and organization | Shift, crew, training status, support coverage |
| Condition | Temperature, speed, load, tool age, maintenance state |
Stratification can reveal patterns that disappear inside averages. The objective is not to search for a person to blame. It is to identify the conditions in which the gap appears and the conditions in which it does not.
Go to the process to learn. Reports show results; direct observation helps explain the conditions that produced them.
05 • Containment, Correction, and Corrective Action
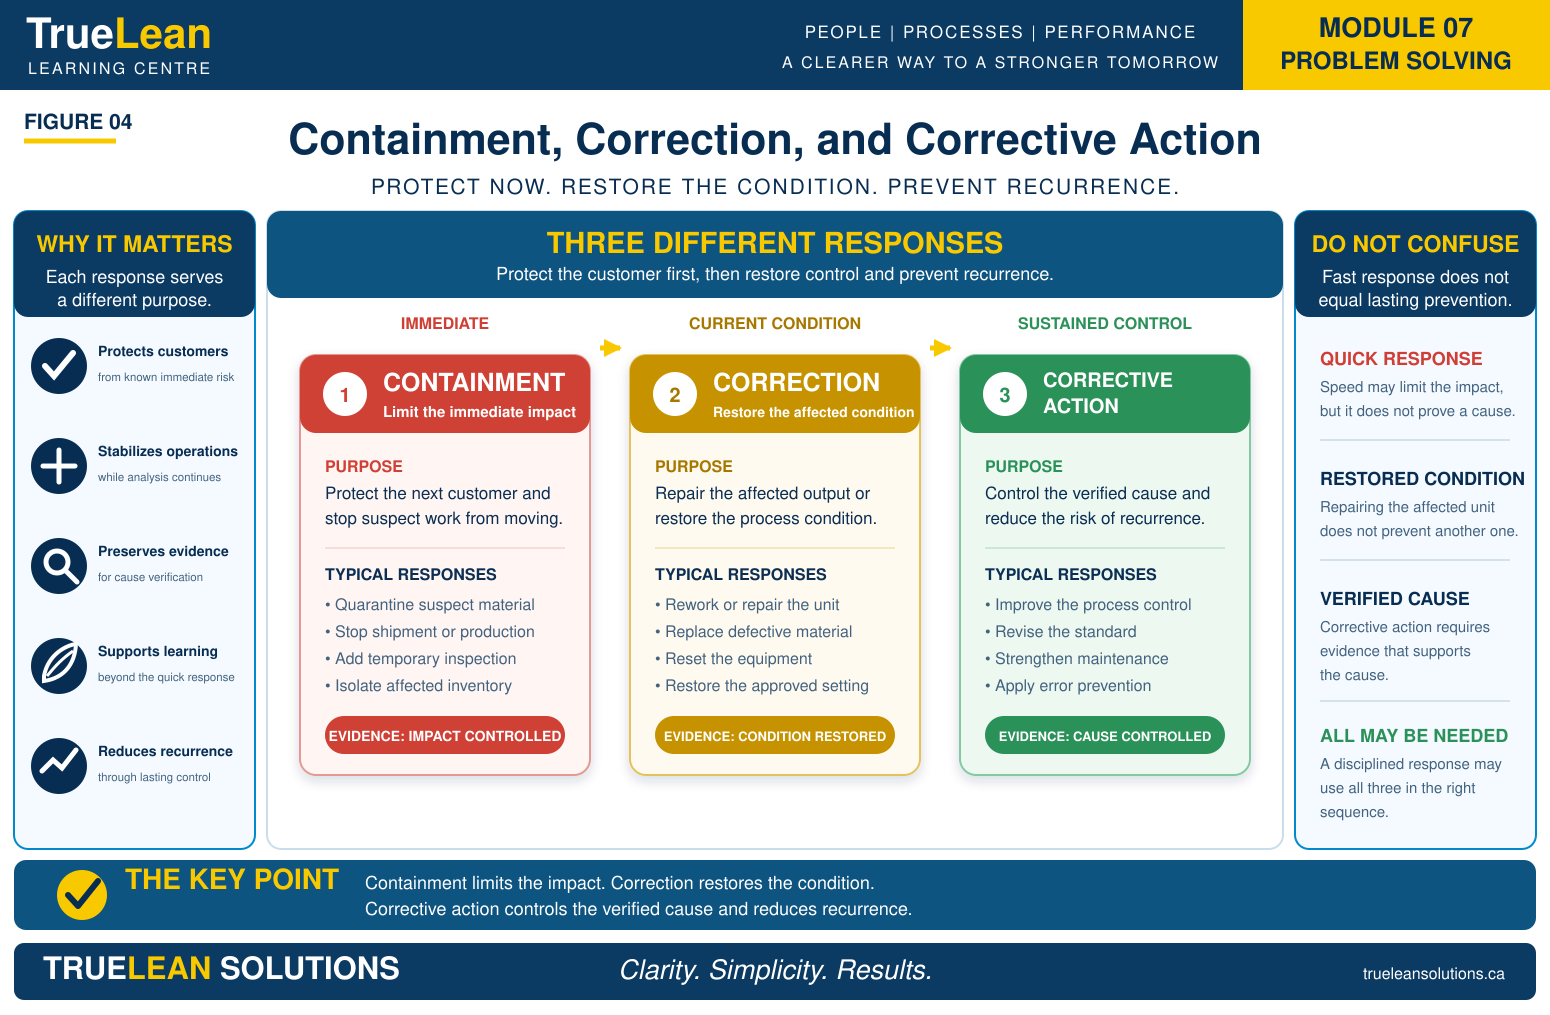
These responses serve different purposes and should not be treated as interchangeable.
| Response | Purpose | Example |
|---|---|---|
| Containment | Limit immediate exposure and protect the customer. | Identify suspect units, stop shipment, or isolate affected material. |
| Correction | Restore the detected item or immediate condition. | Repair a unit, replace a component, or reset a process. |
| Corrective action | Eliminate or control a verified cause to reduce recurrence. | Change a fixture, control a parameter, or redesign the work method. |
Containment may be urgent and extensive when safety, regulatory, or customer risk is high. It should have clear ownership, traceability, review timing, and exit criteria. Temporary controls should not become permanent substitutes for corrective action.
Protect the customer first, but do not allow containment to become the end of the investigation.
06 • Root Cause Analysis
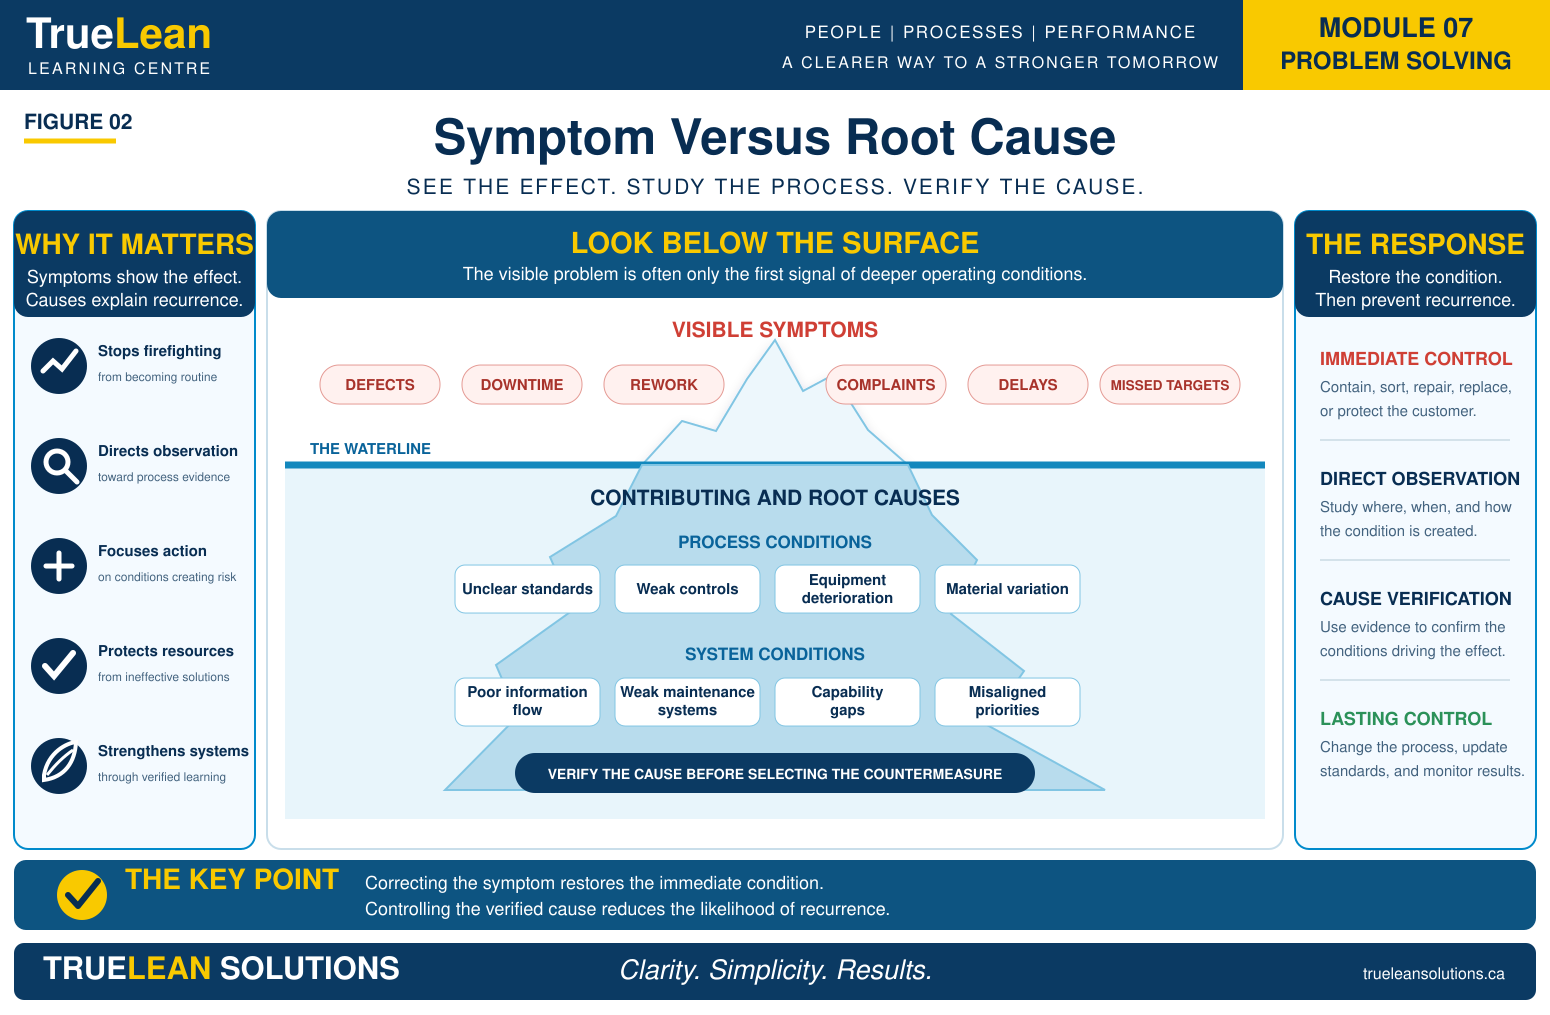
Root cause analysis examines the conditions that produced the problem and determines which causes must be controlled to prevent recurrence. A useful investigation distinguishes the visible symptom, the direct cause, contributing conditions, and the deeper system causes that made the event possible or likely.
Symptom versus cause
Defects, downtime, rework, missed targets, complaints, and delayed shipments are usually visible effects. The conditions below the surface may include unclear standards, equipment deterioration, material variation, weak information flow, inadequate process controls, competing priorities, or gaps in capability development.
Five Whys
Five Whys follows a cause chain by repeatedly asking why a condition occurred. The number five is not a rule. The team should stop when the evidence identifies a controllable cause and continue when the explanation remains superficial.
Cause and effect analysis
A cause and effect diagram broadens the investigation across categories such as people, methods, machines, materials, measurement, and environment. It organizes possible causes but does not prove them. Each important hypothesis must still be verified.
Operator error is rarely a complete explanation. The investigation should also examine task design, standards, tools, training, workload, information, supervision, maintenance, and error prevention controls.
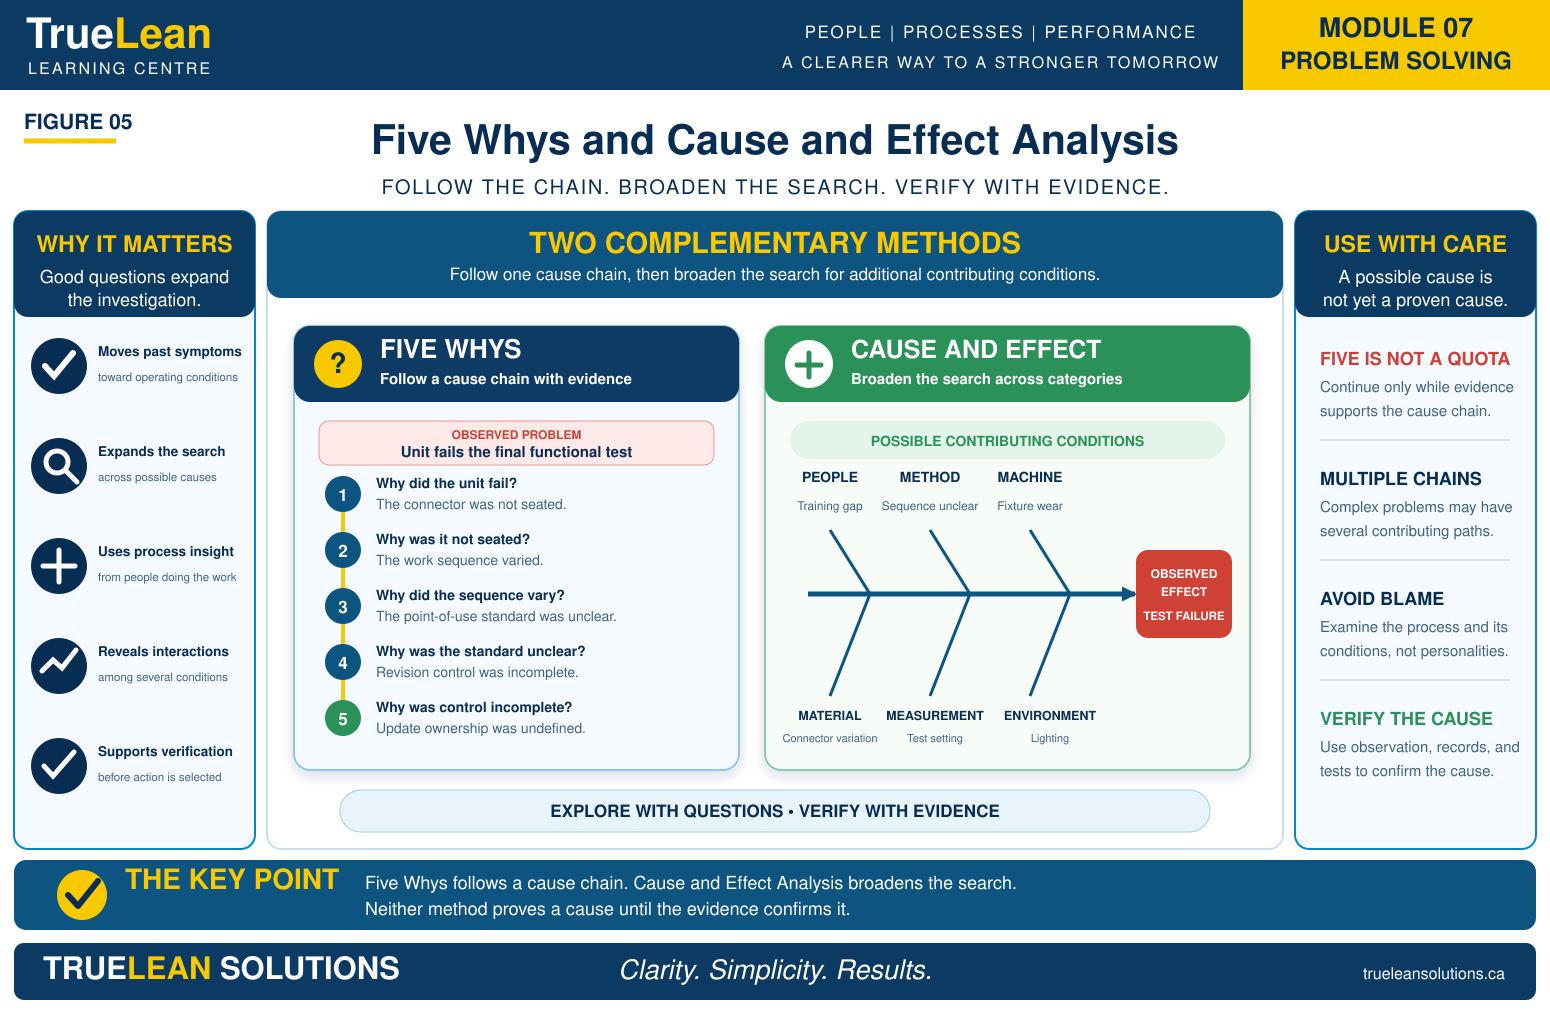
A plausible explanation becomes a verified cause only when evidence shows that it influences the problem.
07 • PDCA as a Learning Cycle
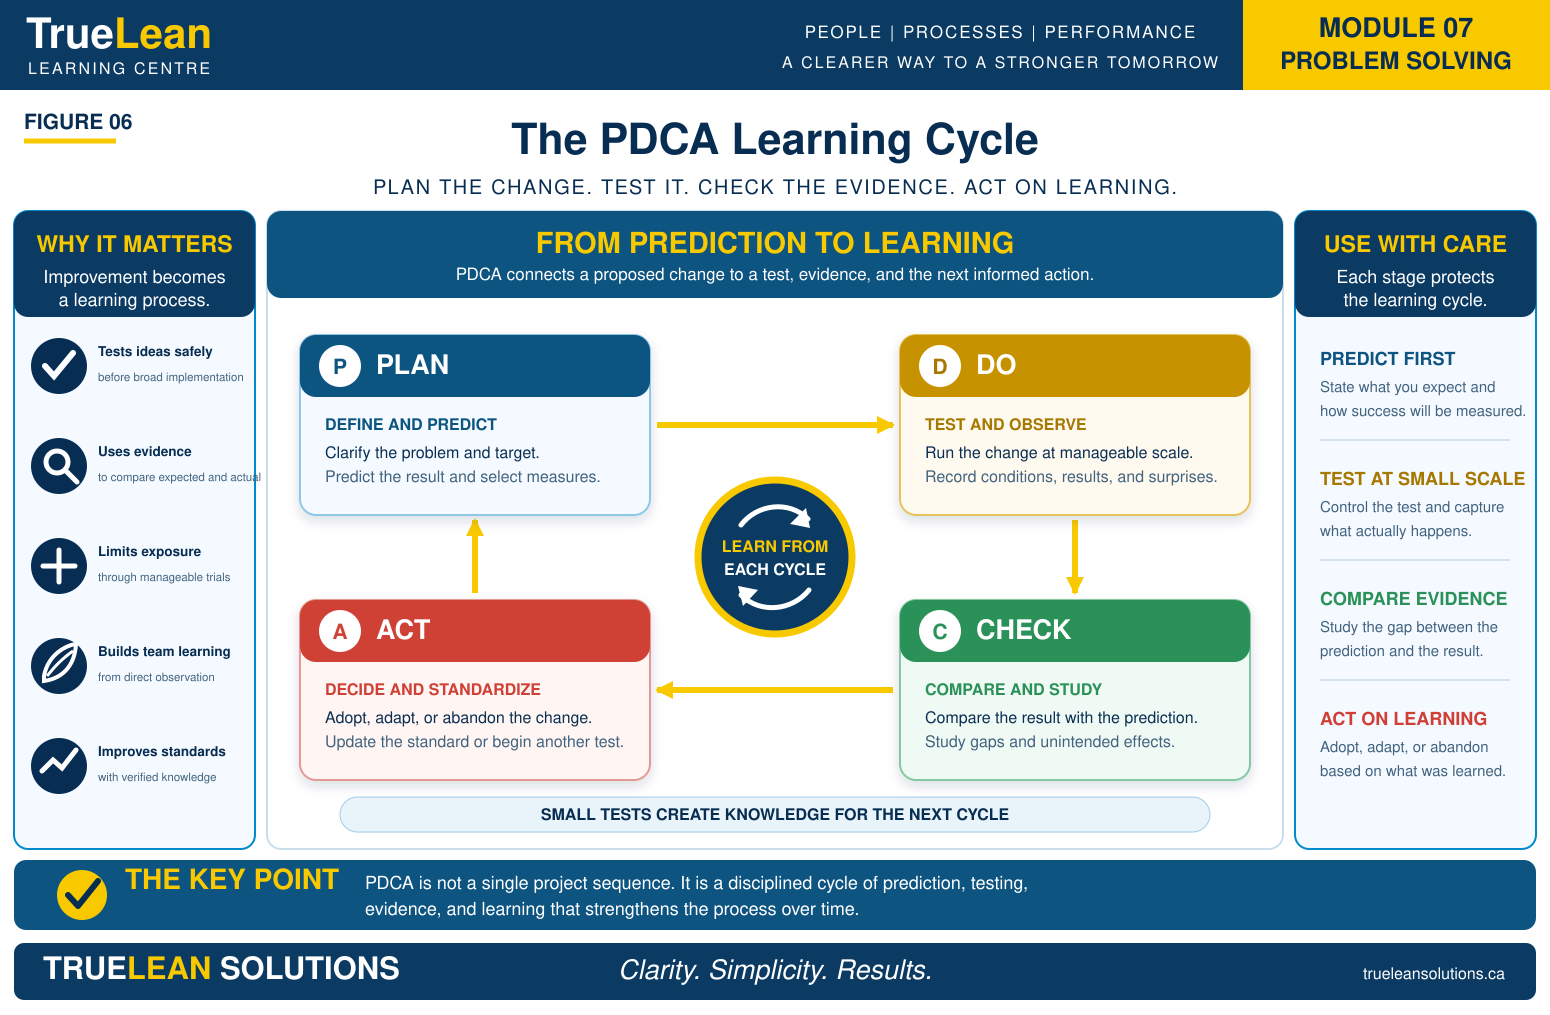
PDCA connects planning, controlled testing, evaluation, and adjustment. It is most useful when the team states what it expects to happen and then compares the prediction with the actual result.
| Stage | Core question |
|---|---|
| Plan | What gap are we addressing, what do we believe, and what result do we predict? |
| Do | How will we test the change safely and collect reliable evidence? |
| Check | What happened, how does it compare with the prediction, and what did we learn? |
| Act | What should be adopted, adjusted, abandoned, standardized, or tested next? |
For example, a team may predict that controlling fastener presentation will reduce cross threading during one shift. The team tests the countermeasure on one station, compares the result with the baseline, observes unintended effects, and decides the next cycle.
PDSA replaces Check with Study to emphasize interpretation and learning. Both forms require disciplined comparison between the intended result and the observed result.
08 • A3 Thinking and Communication
Toyota developed and institutionalized A3 as a management process for problem solving, improvement, planning, communication, coaching, and organizational learning. It connects PDCA, fact based analysis, collaboration, decision making, and follow up on a concise visual page.
Typical A3 structure
Background and business context
Current condition and measurable problem
Target condition
Cause analysis
Countermeasures
Implementation plan
Follow up measures and results
Learning and standardization
The A3 owner develops the thinking through observation and dialogue. The coach tests the logic with questions rather than supplying every answer. A3 becomes administrative when the organization rewards completion of the page more than the quality of the reasoning.
Useful coaching questions
What should be happening?
What is happening now?
What evidence supports that statement?
Which cause has been verified?
Why should this countermeasure influence that cause?
What result do you predict?
How and when will effectiveness be confirmed?
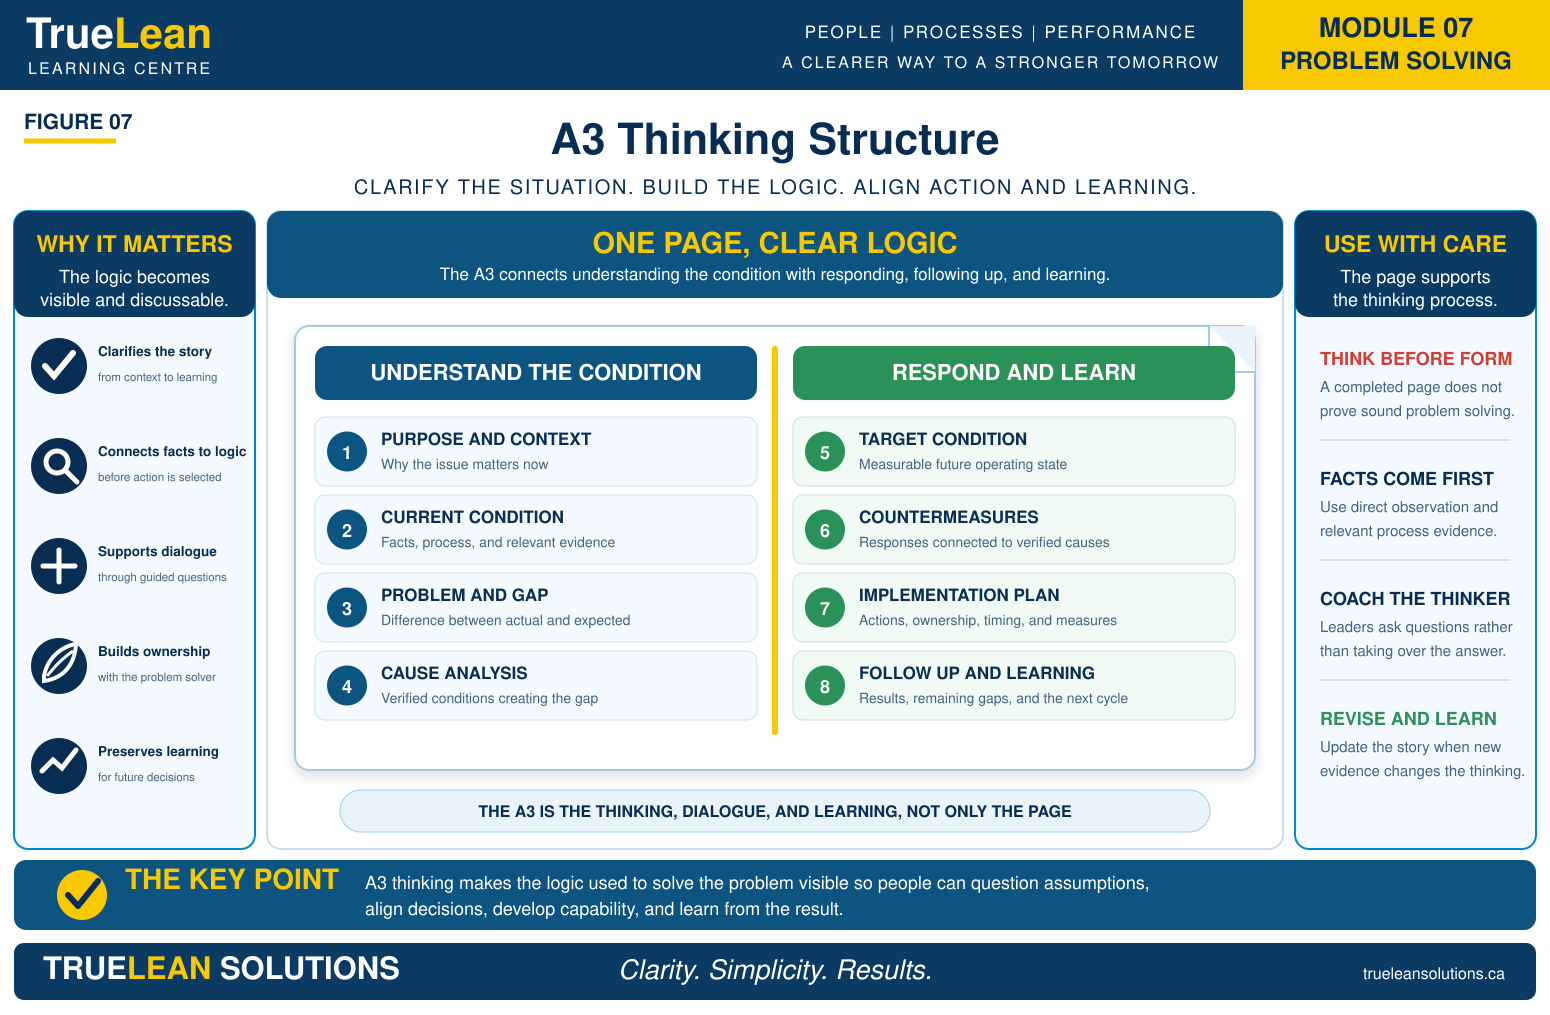
The A3 page makes the reasoning visible. The learning process, coaching, and follow up create the value.
09 • Select and Test Countermeasures
A countermeasure should change or control the condition that produced the problem. It is not selected because it is familiar, inexpensive, or easy to announce. The connection between cause and countermeasure should be explicit.
Countermeasure selection criteria
Direct connection to a verified cause
Protection of safety, quality, delivery, cost, and people
Feasibility within the operating environment
Ability to test on a controlled scale
Clear ownership and timing
Defined prediction and success measure
Acceptable risk of unintended consequences
Training, reminders, added inspection, and disciplinary action may appear decisive, but they are weak when the process design remains unchanged. Stronger controls reduce dependence on memory, make abnormalities visible, prevent error, or stabilize the critical operating condition.
Do not ask only whether the action was completed. Ask whether it changed the condition that produced the gap.
10 • Confirm Effectiveness and Prevent Recurrence
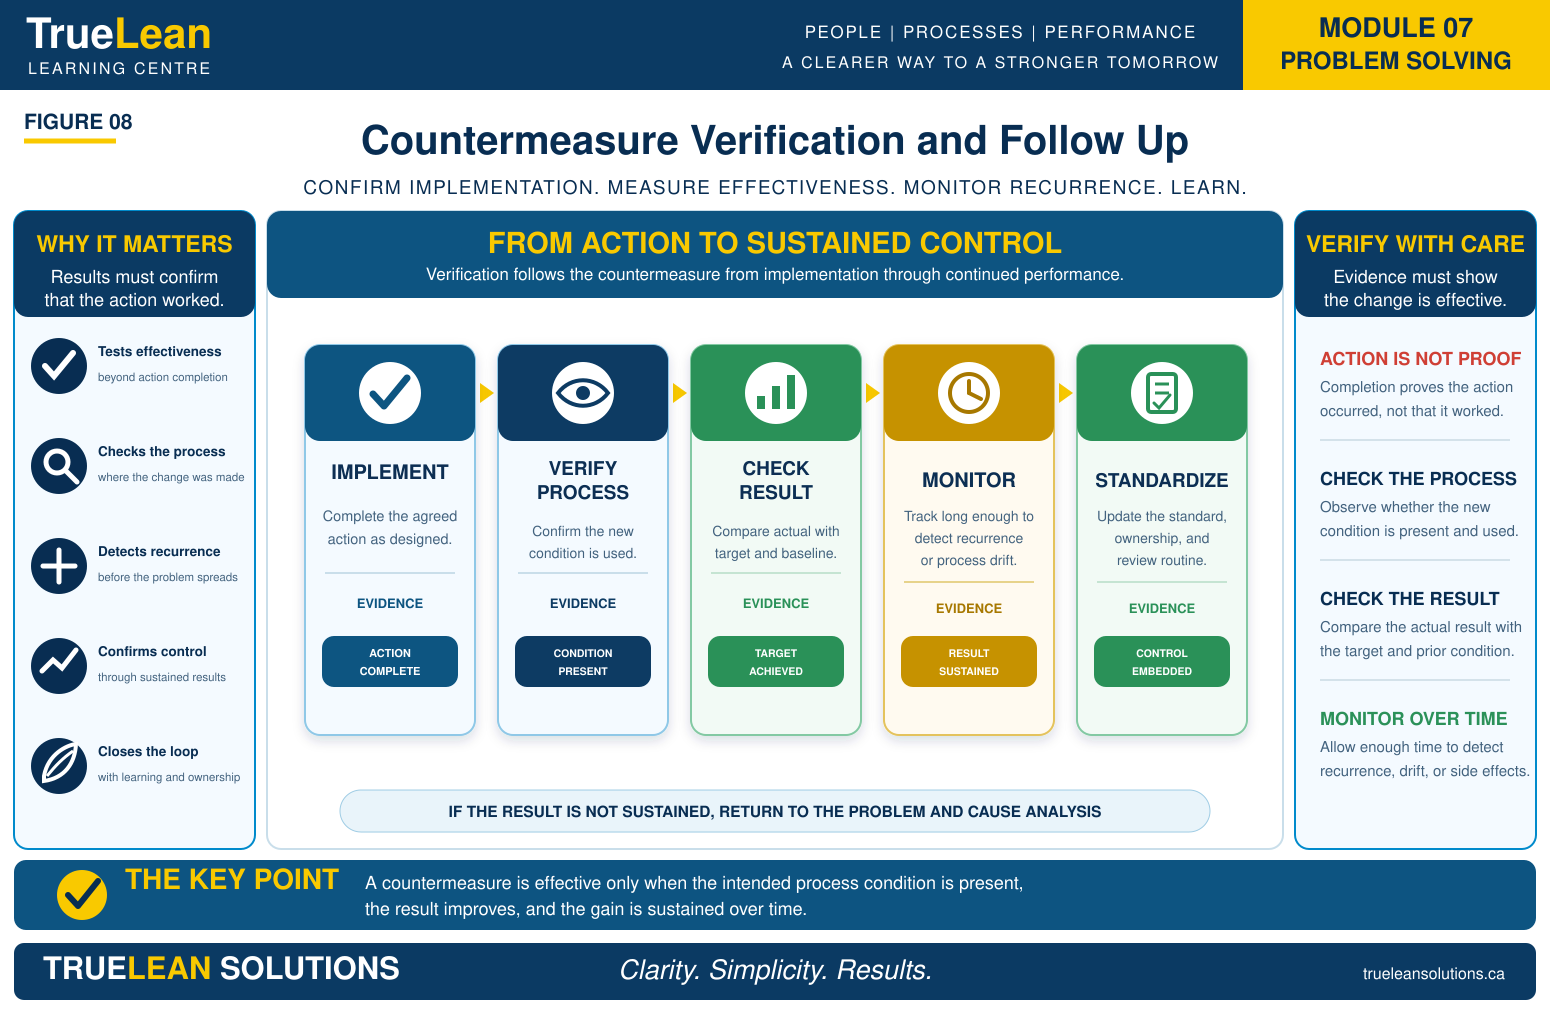
Implementation does not demonstrate success. The team must verify that the countermeasure is in place, the process responds as intended, the operational result improves, and the result continues under normal conditions.
| Verification level | Evidence |
|---|---|
| Action completion | The planned change was installed, released, or communicated. |
| Process verification | The critical condition is controlled during actual work. |
| Result verification | The defined performance gap has improved against the baseline. |
| Sustainment | The result continues across the required shifts, products, and time period. |
| Recurrence control | The same failure has not returned and temporary containment can be removed. |
The verification period should reflect the frequency, risk, process cycle, and natural variation of the problem. A low frequency failure may require a longer period than a daily defect. The team should define the evidence and review timing before declaring closure.
12 • Leadership and Problem Solving Culture
Leaders create the conditions in which problems are either exposed or hidden. If employees are blamed, ignored, or penalized for raising abnormalities, reporting will decline and recurring problems will remain invisible until the impact becomes larger.
Leadership behaviours that strengthen problem solving
Respond calmly when a problem is raised.
Go to the process and ask before prescribing.
Separate immediate protection from longer term investigation.
Expect facts while allowing employees to say what is not yet known.
Provide time, access, and cross functional support for investigation.
Coach the reasoning rather than taking ownership away from the problem solver.
Review overdue actions and effectiveness without rewarding superficial closure.
Recognize learning, prevention, and honest escalation.
Management systems should connect daily accountability with deeper investigation. Tiered meetings, quality reviews, maintenance reviews, corrective action boards, A3 reviews, and leader standard work can help issues move to the right level without losing ownership at the source.
Problem solving culture is revealed by what happens after someone exposes a problem.
13 • Measure Problem Solving Capability
The number of investigations opened or actions closed does not demonstrate effectiveness. Measures should show whether operational performance improved, recurrence decreased, causes were verified, learning was standardized, and people developed the ability to solve problems.
Capability indicators
Leaders actively coaching problem solving
Employees participating in investigations
Teams using direct observation and process data
Problem solvers demonstrating competence
Learning shared across similar processes
Improvements incorporated into standard work
Cross functional participation in complex problems
Balance speed with quality
Some problems require immediate response, while others require extended observation and testing. A single closure time target may encourage teams to select easy problems, reduce investigation depth, or close actions before effectiveness is known.
Performance reviews should consider risk, complexity, frequency, customer impact, required test duration, availability of evidence, and quality of the final result.
| Measurement area | Example |
|---|---|
| Operational result | Defect rate decreased from 4.6 percent to 1.2 percent |
| Recurrence | No repeat failure during the defined verification period |
| Response | Customer risk contained within four hours |
| Investigation quality | Cause verified through process testing |
| Effectiveness | Target sustained across all shifts |
| Standardization | Revised method incorporated into standard work |
| Capability | Process owner completed and presented the investigation |
The strongest problem solving measure is not how many actions were closed. It is how reliably the organization converts abnormalities into learning and sustained performance.
14 • Practical Gemba Reflection
Structured problem solving begins by observing work where value is created and where the abnormal condition occurs. This reflection helps leaders and teams examine a real operating problem without immediately prescribing a solution. It is not a replacement for a formal investigation when safety, regulatory, customer, or financial risk is significant.
Select one recurring problem
Has occurred more than once
Affects safety, quality, delivery, cost, or productivity
Can be observed directly
Has a defined process owner
Is important enough to investigate
Is manageable within a clear scope
Observe the process
Expected and actual work sequence
Material and information flow
Equipment and tooling condition
Standard work and process settings
Visual controls and abnormality response
Workarounds and differences among products, shifts, or operators
Describe the performance gap
The expected condition is:
The actual condition is:
The measurable gap is:
The problem occurs when:
The problem does not occur when:
The customer or business impact is:
The immediate risk is:
Separate what is known from what is assumed
| Known through evidence | Assumed or requiring verification |
|---|---|
| Facts observed directly | Possible explanations |
| Confirmed measurements | Opinions |
| Recorded process conditions | Suspected causes |
| Verified timing and location | Unconfirmed relationships |
Identify the next learning step
Observe another production cycle
Stratify data by shift or product
Compare affected and unaffected conditions
Review maintenance history
Confirm the applicable standard
Test a suspected cause
Map the process
Examine a material lot
Measure cycle time variation
Interview employees who perform the work
Leadership reflection
Did I ask questions before suggesting a solution?
Did employees feel safe describing the problem?
Did we observe actual work?
Did we separate evidence from assumptions?
Did we distinguish containment from corrective action?
Are we allowing enough time to learn?
Who owns the next step?
When will we review the evidence?
The Gemba does not automatically reveal the answer. It provides the conditions for better observation, stronger questions, and evidence based learning.
Need help strengthening problem solving capability?
TrueLean Solutions helps manufacturing leaders make problems visible, develop capable problem solvers, improve corrective action, and connect learning with sustained operating performance.
Schedule a Consultation15 • Key Takeaways
Define the gap clearly: A problem is the measurable difference between expected and actual performance.
Observe the actual process: Combine reliable data with direct observation of the work.
Protect the customer without ending the investigation: Containment, correction, and corrective action serve different purposes.
Verify causes with evidence: A plausible explanation is not automatically a root cause.
Look beyond human error: Examine task design, standards, tools, workload, information, supervision, and controls.
Use PDCA to learn: Compare predictions with actual results and use the difference to guide the next cycle.
Treat A3 as a thinking process: The document makes reasoning visible, but completing the format is not the objective.
Connect countermeasures to verified causes: Actions should control the conditions that produced the problem.
Confirm effectiveness: Implementation alone does not demonstrate success.
Standardize and share learning: Incorporate effective changes into standards, training, controls, and management routines.
Measure recurrence and capability: Closed actions are weaker evidence than sustained results and demonstrated competence.
Leadership determines the culture: Leaders create the conditions in which problems are exposed, investigated, and learned from.
Strong organizations do not avoid every problem. They make problems visible, learn from them systematically, and improve the conditions that allowed them to occur.
Continue Learning
16 • Sources and Further Reading
Structured Problem Solving and Quality Methods
American Society for Quality, Eight Disciplines Problem Solving Process
American Society for Quality, Fishbone Diagram: Cause and Effect Analysis
International Organization for Standardization, Quality Assurance
National Aeronautics and Space Administration, Root Cause Analysis
PDCA and Improvement Testing
Massachusetts Institute of Technology OpenCourseWare, The PDCA Continuous Improvement Cycle
Institute for Healthcare Improvement, Plan Do Study Act Worksheet