
Pull is more than a Kanban card or inventory-reduction target. It is a disciplined way of connecting demand, consumption, replenishment, inventory and production authorization so the operating system responds to what is actually needed.
01 · Learning Objectives
Pull systems are sometimes reduced to Kanban cards, supermarkets or inventory reduction. Effective pull requires something more fundamental: a clear connection between actual demand, material consumption, replenishment, production authorization and the capability of the operating system.
- Explain the practical difference between push and pull production control.
- Recognize when continuous flow, FIFO, supermarket pull, Kanban or another WIP-control method may be appropriate.
- Explain why inventory exists and what operating conditions it may protect.
- Distinguish cycle stock, buffer stock and safety stock.
- Explain how consumption creates a replenishment signal.
- Describe how supermarkets and Kanban loops control replenishment.
- Calculate an initial Kanban requirement using demand, replenishment lead time, protection and container quantity.
- Evaluate replenishment frequency, container quantity and WIP limits.
- Understand how ERP/MRP planning and pull execution can work together.
- Recognize where CONWIP may be useful, particularly in high-mix environments.
- Explain the role of the pacemaker process and production leveling.
- Identify operating conditions that prevent pull from functioning effectively.
- Use operating evidence to determine where inventory can be safely reduced.
- Evaluate a pull system at Gemba and identify practical improvement opportunities.
The objective of pull is not to eliminate inventory. The objective is to connect work to actual demand while controlling inventory, WIP and replenishment in a visible and disciplined way.
02 · Key Terms
A production-control method in which downstream consumption or demand authorizes upstream replenishment or production.
A method in which production or movement is initiated primarily from a forecast, schedule, plan or predetermined instruction rather than direct downstream consumption.
A controlled inventory location from which a downstream process withdraws required material and an upstream process replenishes what has been consumed.
A controlled signal that authorizes production, withdrawal or replenishment of a defined quantity.
Restoring material that has been consumed according to defined quantities, signals and operating rules.
Inventory associated with the normal quantity and frequency of replenishment.
Inventory intentionally maintained to protect against defined variation in customer demand or consumption.
Inventory maintained to protect against defined uncertainty in supply or internal process performance.
First In, First Out. Work proceeds in sequence, normally with a defined maximum quantity allowed between processes.
Work in Process. Material that has entered the production system but has not yet become finished product.
A defined maximum amount of work permitted within a process, lane, cell or production system.
The process through which the value stream is primarily scheduled and controlled.
Constant Work in Process. A production-control approach that limits total work within a defined system rather than necessarily maintaining a product-specific Kanban loop for every item.
Production leveling. The deliberate smoothing of production volume and, where appropriate, product mix over a defined period.
Elapsed time from creation of a replenishment requirement until the required material becomes available again at the point of use.
The standard quantity transported or replenished under one defined signal.
| TERMINOLOGY NOTE Inventory terminology varies among organizations, industries, textbooks and ERP systems. The important requirement is to clearly define why each inventory category exists and what condition it protects against. |
|---|
03 · Why Pull & Inventory Matter
Inventory affects working capital, space, material handling, lead time, obsolescence, quality containment, scheduling complexity and customer responsiveness.
But reducing inventory does not automatically improve an operation.
Suppose five days of components are held between machining and assembly. Management reduces that inventory to two days. Shortly afterward, assembly experiences shortages.
Investigation identifies:
- Frequent equipment failures.
- Long changeovers.
- Variable first-pass yield.
- Large production batches.
- Unstable schedule adherence.
The inventory had been providing protection against those conditions. Removing inventory did not remove the causes.
A stronger improvement sequence
1. Understand why the inventory exists.
2. Quantify the protection actually required.
3. Improve the underlying operating condition.
4. Recalculate the requirement.
5. Reduce inventory deliberately and monitor the result.
Do not remove the protection before improving the condition that made the protection necessary.
Inventory can therefore provide useful operating evidence: High Inventory → Long Replenishment Time → Large Batches → Long Changeovers. The ultimate improvement opportunity may be changeover reduction rather than an arbitrary inventory target.
04 · Push, Pull & the Real Operating System
Push
Production may be initiated by forecasts, MRP requirements, production schedules, batch quantities, capacity plans or management instructions.
Pull
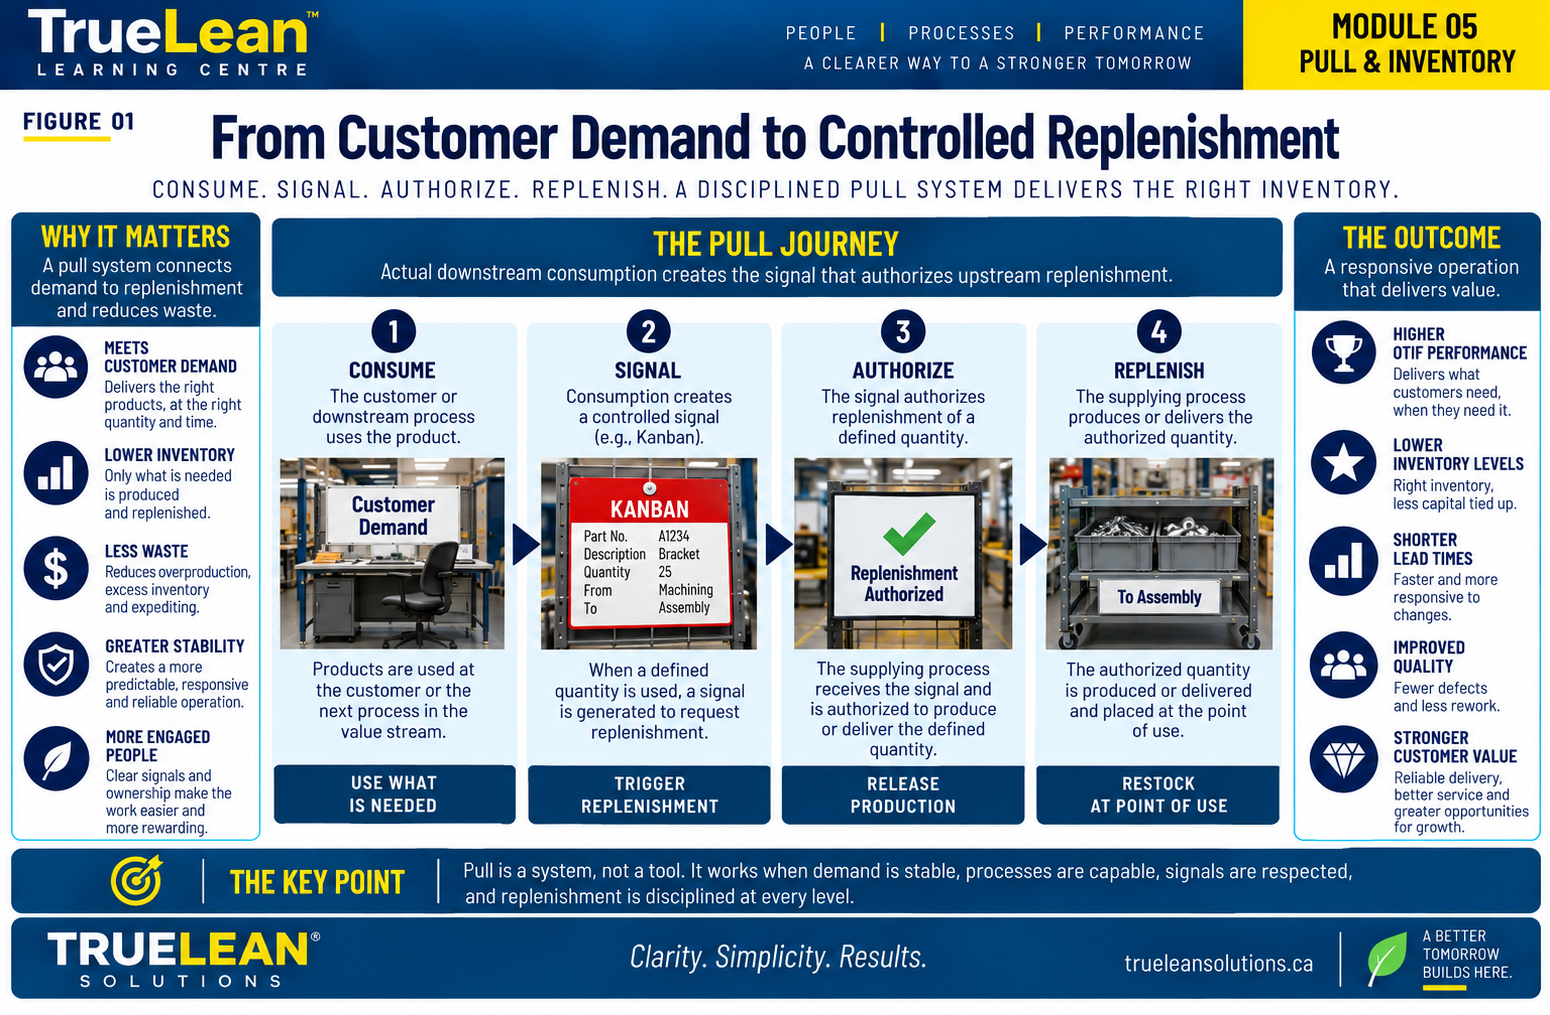
Actual downstream consumption creates authorization for defined replenishment.
The basic logic is:
Pull is not the same as make-to-order
A manufacturer can make finished goods to stock while using pull internally. Likewise, a make-to-order manufacturer can still push work through its production system using centrally released schedules. Pull describes how work is authorized, not simply whether a customer order exists.
Planning and execution
Planning asks: What are we likely to need? Execution asks: What should we produce or replenish now? ERP/MRP can support planning, purchasing, capacity, long-lead materials and customer-order management while pull controls selected execution and replenishment.
MRP can plan. Pull can execute. This is not a universal architecture; the appropriate division depends on the operating environment.
05 · Inventory Has a Purpose
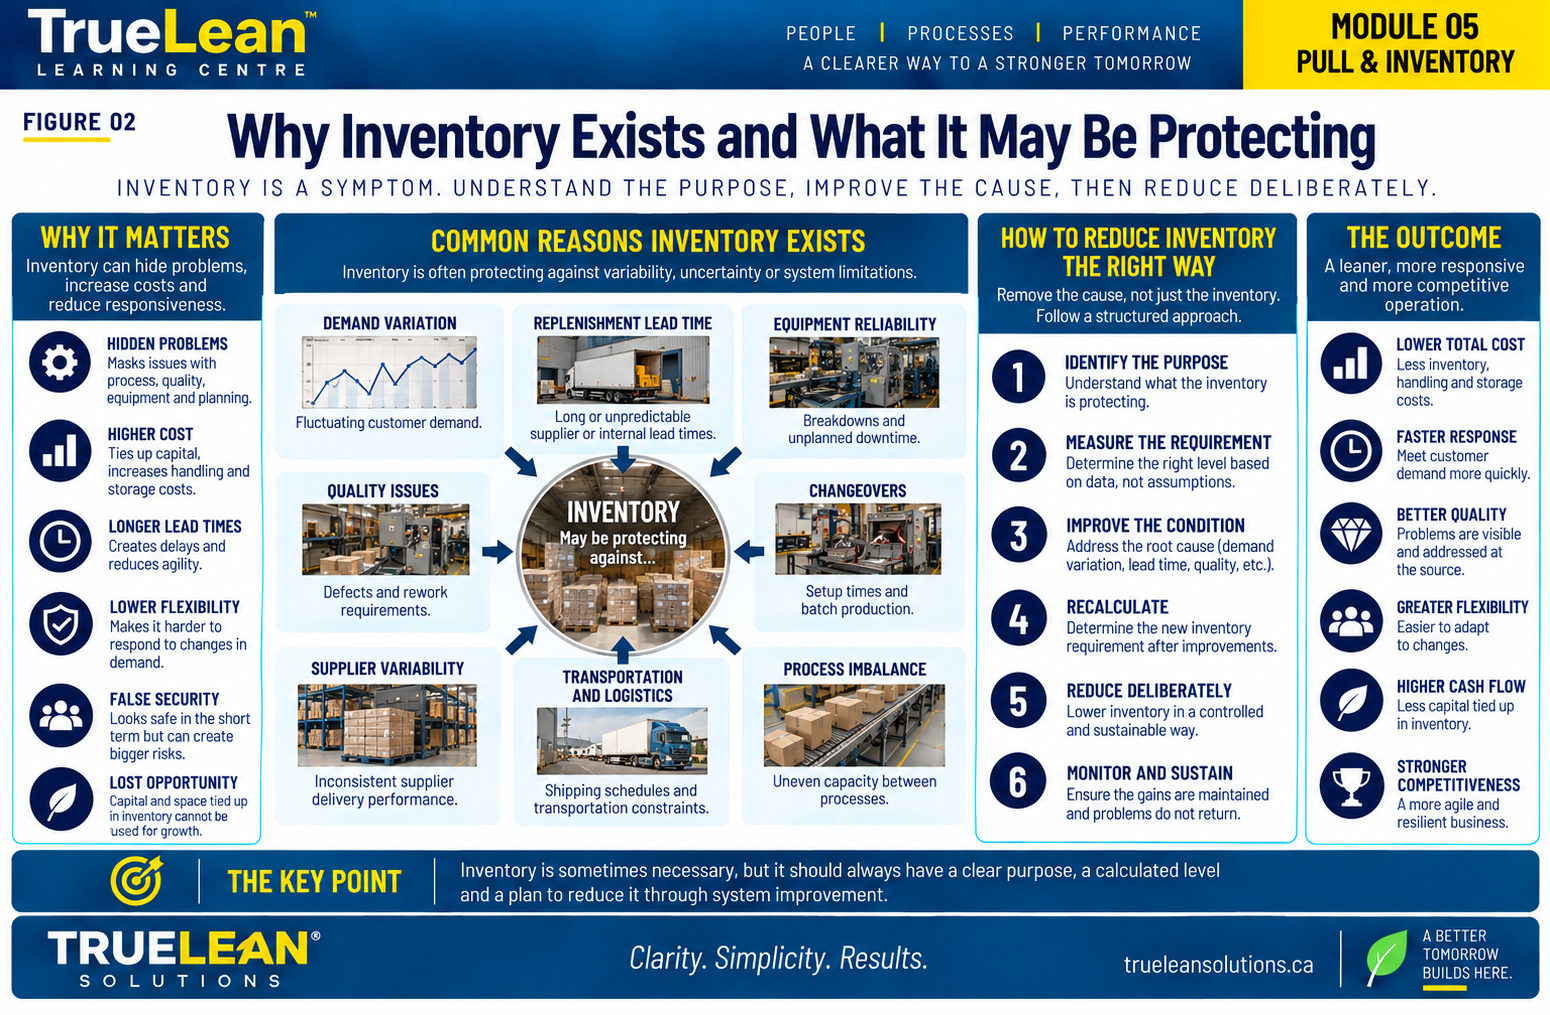
Inventory may protect against replenishment lead time, demand variation, equipment downtime, quality losses, long changeovers, supplier variability, transportation frequency, batch-processing requirements, capacity differences and schedule instability.
Two operations can each carry 1,000 units of WIP and have completely different management conditions. One may have a calculated, controlled buffer with defined ownership and replenishment rules. The other may simply have 1,000 units accumulated between departments because each process produces independently. The quantity alone does not tell the full story.
When inventory provides necessary protection, define its purpose, control its quantity, improve the underlying condition and then reassess the requirement.
06 · Understanding Inventory Types
Cycle Stock
Suppose assembly consumes 200 components/day and machining replenishes every two days.
If consumption is approximately uniform, average cycle stock is approximately 400 ÷ 2 = 200 components. If replenishment improves to daily, the replenishment quantity becomes 200 and average cycle stock becomes approximately 100. The reduction comes from smaller, more frequent replenishment.
Buffer Stock
Average demand is 200 units/day. Observed one-day demand can rise to 240 units/day.
This is an instructional example, not a universal buffer-stock formula.
Safety Stock
Normal replenishment is 2 days. Observed delayed replenishment is 3 days. Average consumption is 200 units/day.
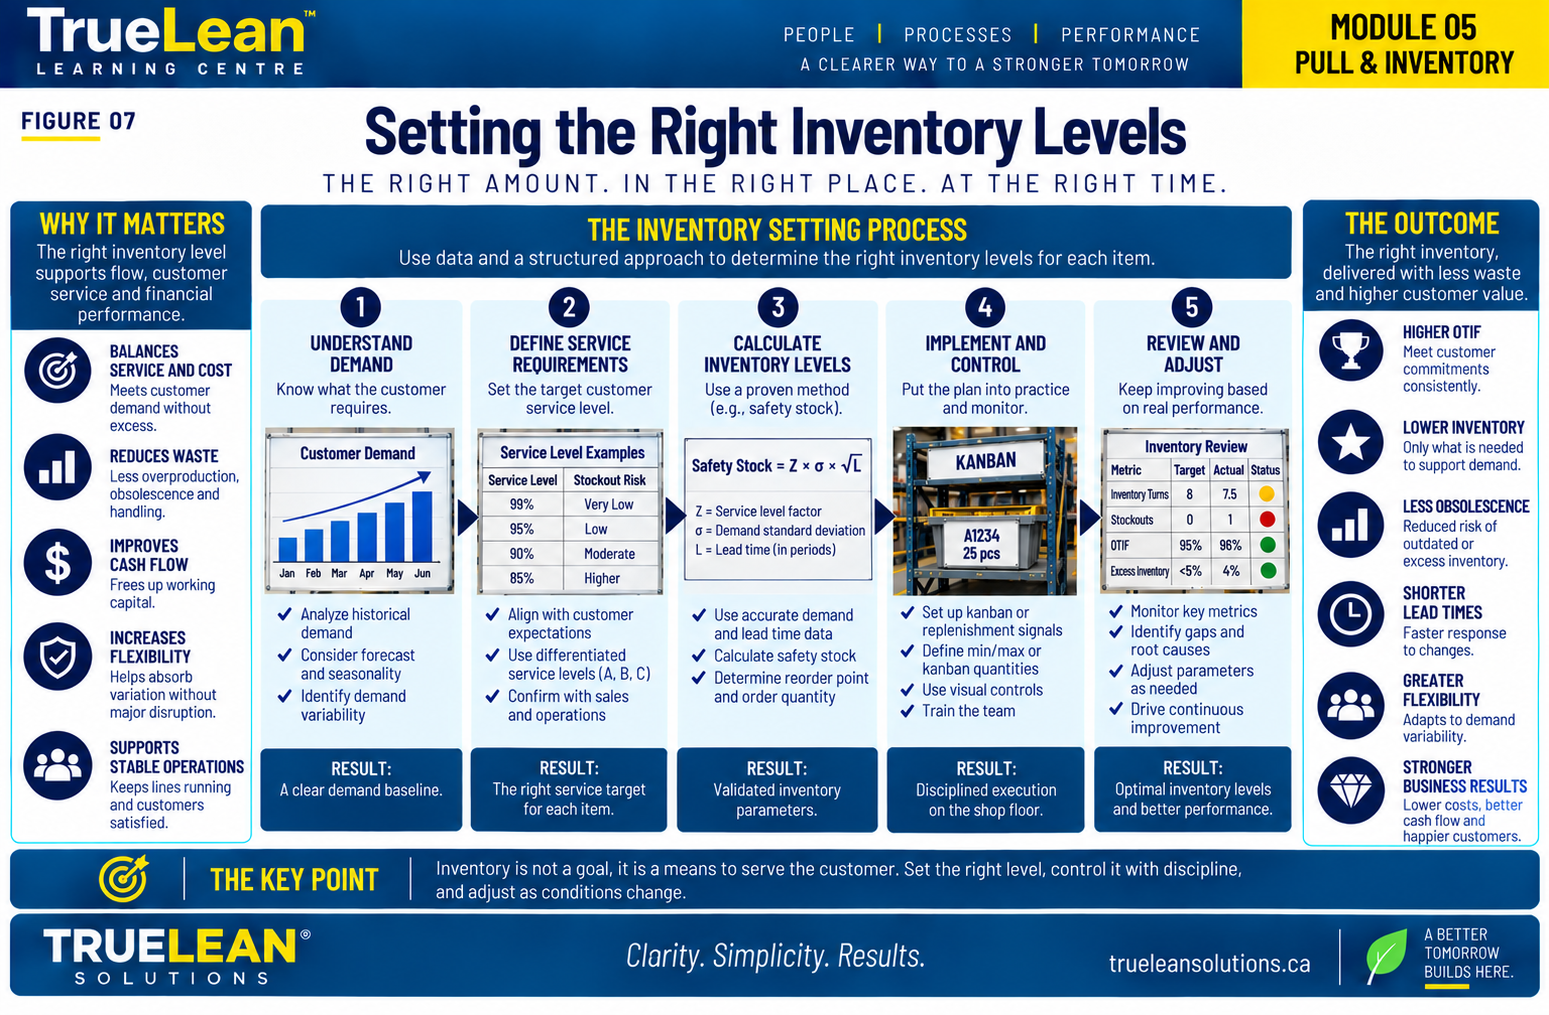
More advanced safety-stock methods may incorporate demand variation, lead-time variation, service level, forecast error and statistical distributions.
07 · Inventory as a Signal of System Conditions
A stronger Gemba question than “Why is there so much inventory?” is: What operating condition caused this inventory to accumulate here?
- Large WIP queues may indicate batching, imbalance or constraints.
- Frequent shortages may indicate replenishment failure, instability or incorrect parameters.
- Large safety stocks may indicate supply, quality, equipment or lead-time uncertainty.
- High cycle stock may indicate large replenishment quantities or infrequent replenishment.
A plant can simultaneously have too much inventory and too many shortages when it has the wrong material, quantity, location, timing or production sequence.
The goal is not minimum inventory at any cost. The goal is the minimum controlled inventory that reliably supports customer requirements under current operating conditions, followed by continued improvement of those conditions.
08 · Consumption Creates the Replenishment Signal
The central pull relationship is: Replenish what has been consumed, in the defined quantity, through a controlled signal.
If one container contains 20 brackets, one valid consumption signal authorizes replenishment of 20 brackets. Three consumed containers create three defined replenishment requirements.
Pull does not mean every consumption event must immediately start a machine. The signal may authorize material movement, upstream production, supplier replenishment or another defined action.
09 · Supermarkets & Replenishment Points
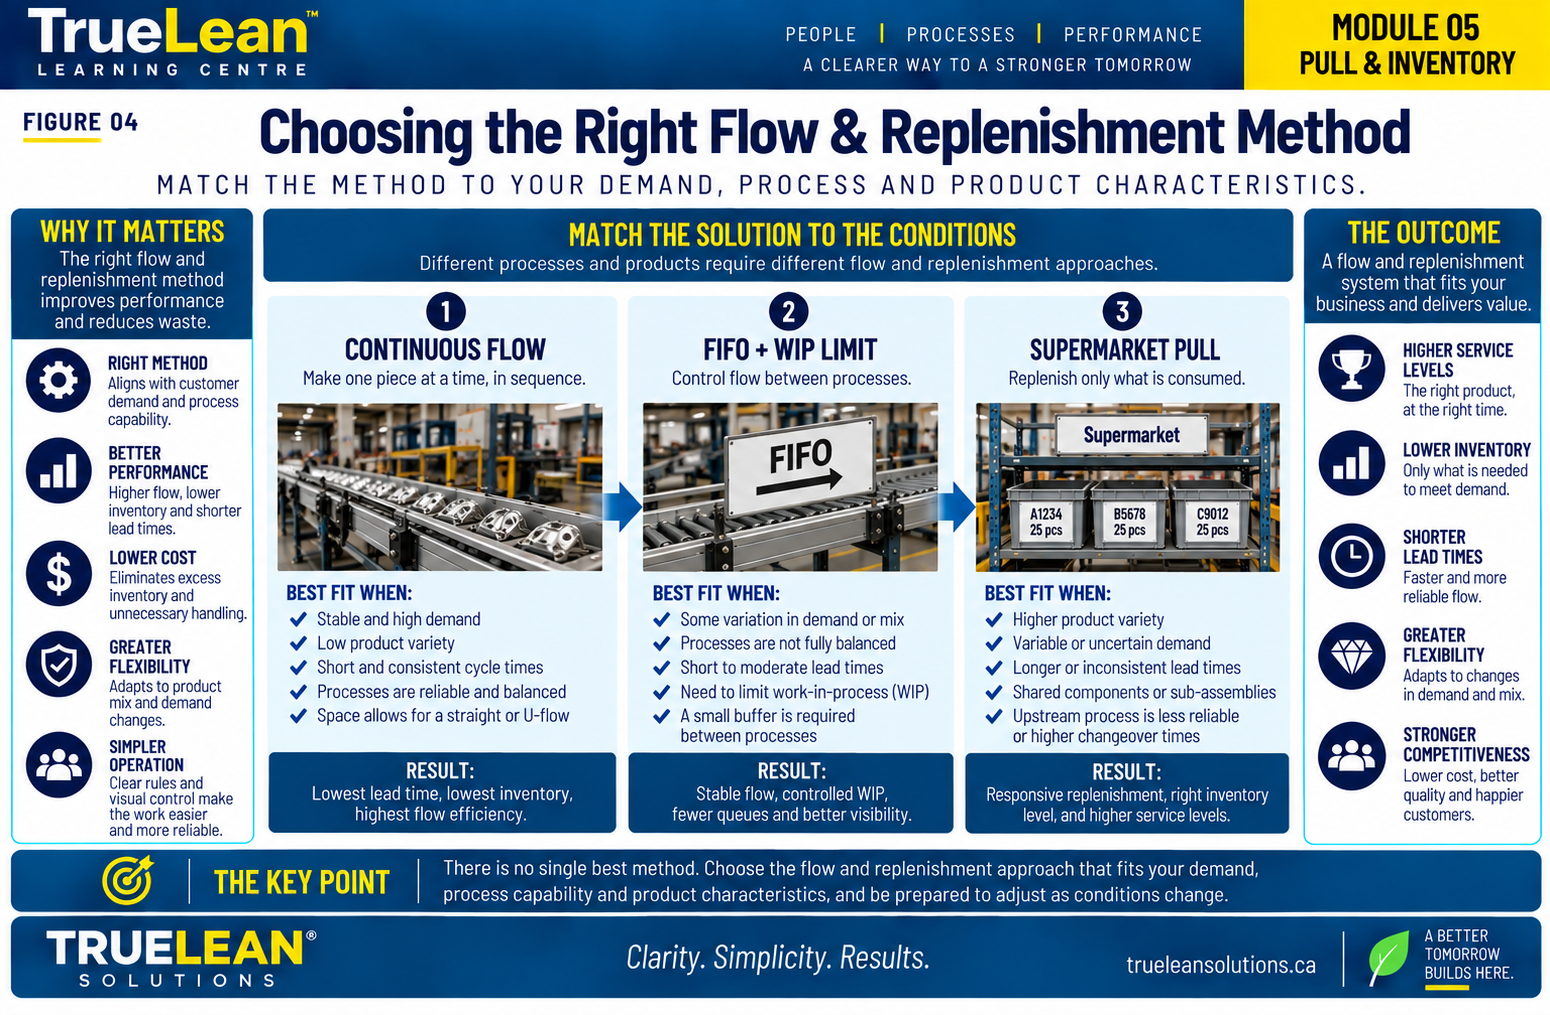
Continuous flow is preferred where processes can be directly connected reliably. Where that is not practical, a controlled supermarket can provide a deliberate interface.
A supermarket should define:
- Items.
- Quantities.
- Container sizes.
- Locations.
- Replenishment triggers.
- Sources.
- Frequency.
- Ownership.
- FIFO requirements.
- Abnormality rules.
A rack full of inventory is not automatically a supermarket. If a supermarket repeatedly empties, the response should not automatically be to add inventory. Investigate demand, replenishment, quality, equipment, signals and parameter accuracy.
11 · Withdrawal & Production Kanban
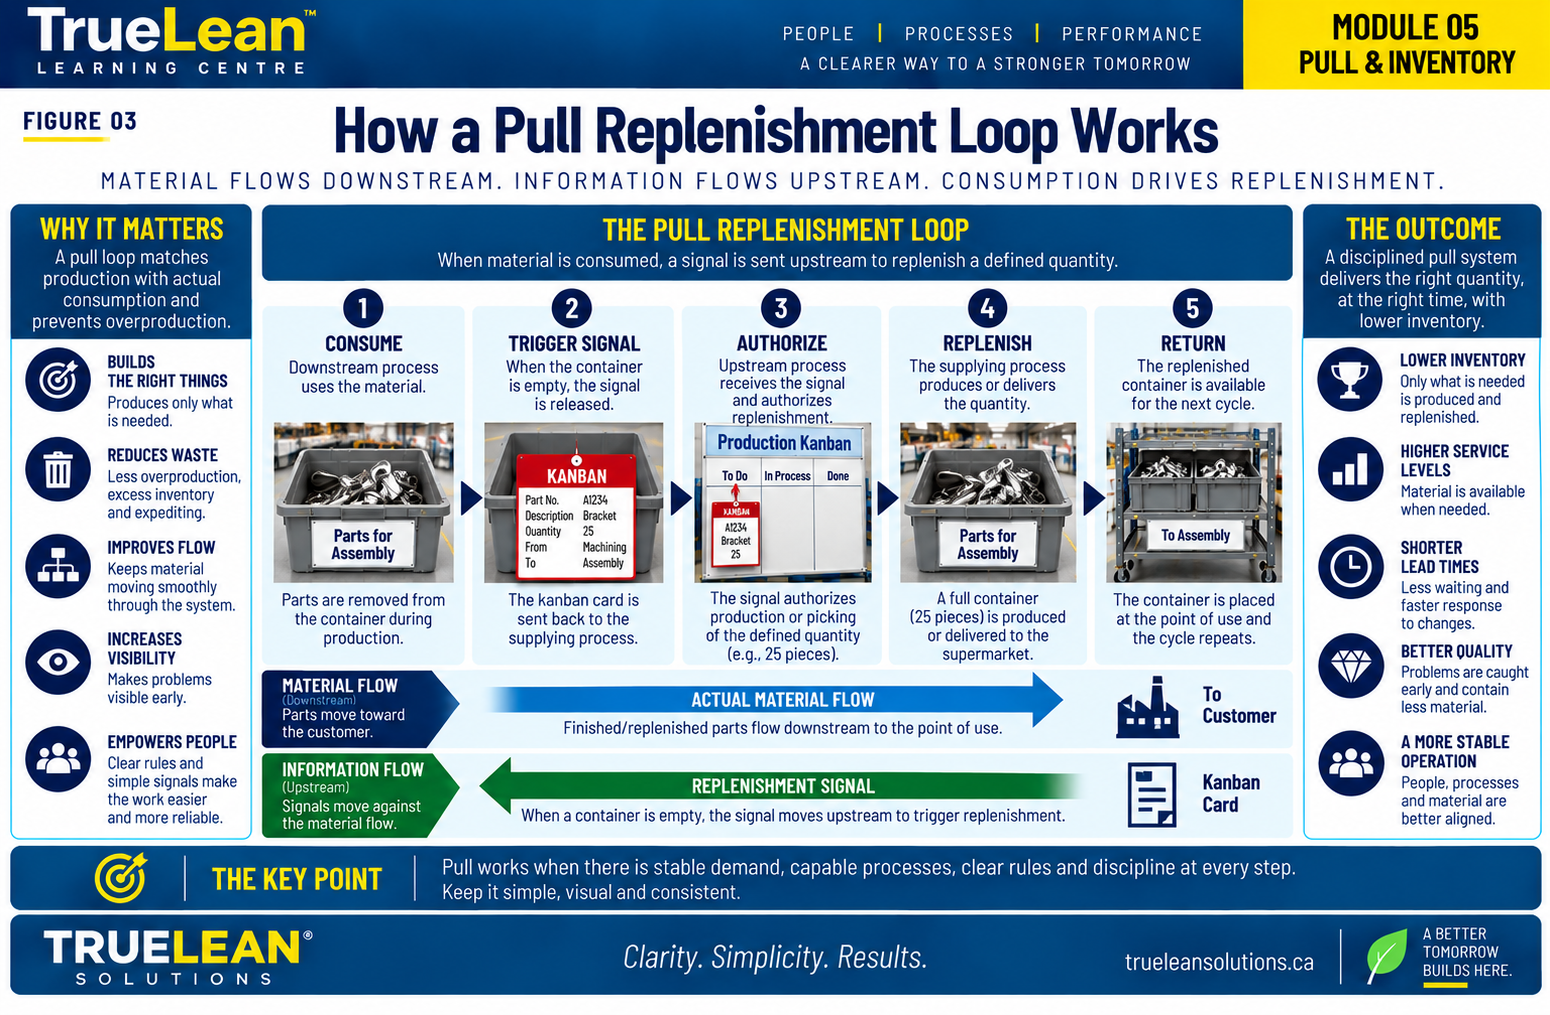
A withdrawal Kanban authorizes movement. A production Kanban authorizes replacement.
For a 25-piece container:
- Assembly consumes 25.
- Withdrawal authorizes movement of 25.
- Supermarket supplies 25.
- Production signal authorizes 25.
- Supplying process replenishes 25.
3 containers × 25 pieces = 75 components authorized
Smaller containers can improve replenishment responsiveness but may increase material-handling activity. Container design must therefore consider the complete system.
12 · Replenishment Lead Time, Frequency & Container Quantity
Replenishment lead time includes more than processing time. It may include signal waiting, collection, queue, setup, processing, inspection, movement and restocking.
If the signal is created at 9:00 a.m. and material becomes available at 11:00 a.m., replenishment lead time is 2 hours.
If assembly consumes 240 parts/day and receives two deliveries, each delivery supports approximately 120 parts. If delivery frequency increases to four times per day, quantity per delivery decreases to approximately 60 parts. The benefit exists only if the replenishment process can reliably support the additional frequency.
13 · Determining Initial Kanban Requirements
One useful starting equation is:
- N = Kanban containers or signals.
- D = demand rate.
- L = replenishment lead time.
- S = defined protection factor.
- C = container quantity.
The demand and lead-time units must be compatible.
Worked example
- Daily demand = 240 parts.
- Available time = 8 hours.
- Hourly demand = 240 ÷ 8 = 30 parts/hour.
- Lead time = 2 hours.
- Protection = 15%.
- Container = 10 parts.
After improvement
Lead time improves to 1.5 hours and justified protection is reassessed to 10%.
This is one useful initial sizing method, not a universal Kanban formula. Different operating environments may require other variables or methods.
14 · FIFO Lanes & WIP Limits
FIFO provides sequence. A WIP limit provides control.
If a FIFO lane permits five containers of 20 units:
Once the limit is reached, continued upstream production should normally stop until downstream consumption creates space. The full lane becomes an abnormality signal.
Connection to Little's Law
At 100 units WIP and 200 units/day throughput, implied flow time is 0.5 day. At 300 units WIP with the same throughput, implied flow time is 1.5 days. This comparison assumes the system remains sufficiently stable and throughput remains approximately unchanged.
15 · Continuous Flow, FIFO or Supermarket?
Continuous Flow
Use where processes can be directly connected reliably.
FIFO
Use where sequence can be maintained with a small, controlled amount of WIP.
Supermarket Pull
Use where processes require controlled decoupling and downstream consumption should trigger replenishment.
Decision sequence: Can reliable continuous flow be established? If not, can sequence be maintained with limited WIP? If not, should downstream consumption trigger replenishment from a decoupled process?
Then investigate what prevents tighter flow: changeover, reliability, quality, batch requirements, distance, capacity, transportation or technical constraints.
The objective is not to force every process into one-piece flow. Technical, economic, quality, safety, curing, transportation and other legitimate process constraints may require batching or decoupling.
16 · Pacemaker Process & Scheduling Point
Independently scheduling every department can create conflicting priorities. The pacemaker provides a primary scheduling and control point for the value stream.
Upstream processes still require capacity, maintenance, material and changeover planning. The difference is that production release increasingly supports the value stream rather than isolated departmental schedules.
17 · CONWIP & High-Mix Environments
CONWIP controls total WIP within a defined production system.
If a fabrication stream is limited to 15 jobs, a sixteenth job is not released until an existing job exits.
Example
If the operation can sustain the same throughput with 15 jobs:
This does not mean arbitrarily cutting WIP to 15 will automatically preserve throughput. Too little WIP can starve resources and reduce output. WIP control must therefore be tested against actual system performance.
18 · ERP/MRP & Pull Working Together
ERP/MRP can support orders, forecasts, purchasing, material requirements, capacity, long-lead items, inventory records, bills of material and financial planning. Pull can control selected execution based on actual consumption.
A manufacturer might use ERP/MRP for custom components, long-lead motors, purchasing and capacity planning, while using pull for repetitive brackets, standard fasteners and point-of-use replenishment.
The critical requirement is clear authority. If Kanban authorizes 50 units while MRP independently releases 300 units and production follows both, the system has conflicting control logic.
Technology should support the production-control design rather than create competing instructions.
19 · Heijunka & Production Leveling
Heijunka deliberately levels production volume and, where practical, product mix.
Suppose weekly demand is 500 units over five days. Average daily requirement is 500 ÷ 5 = 100 units/day. A more level volume pattern may target approximately 100 units/day rather than extreme daily swings, provided customer requirements and operating capability support it.
Mix example
Daily requirement: A = 60, B = 30, C = 10. Ratio A:B:C = 6:3:1. A 10-unit repeating sequence could be: A · B · A · A · B · A · C · A · B · A. Repeated ten times, the daily mix is A = 60, B = 30, C = 10.
If each product change requires 45 minutes, frequent sequencing may be impractical. Changeover reduction may therefore be a prerequisite.
Takt and pitch
For a 10-unit container:
20 · Why Pull Systems Fail & How to Improve Them
Pull before stability: Improve reliability, quality, material availability and standard work.
Inventory removed without understanding its purpose: Identify protection, improve the cause, recalculate, then reduce.
Obsolete Kanban quantities: Review demand, lead time, containers and protection periodically.
Signals bypassed: Establish clear authorization and exception rules.
Long changeovers causing overproduction: Apply changeover reduction and SMED principles.
Oversized containers: Evaluate consumption, handling, ergonomics, packaging and frequency.
ERP and pull issuing conflicting instructions: Define planning authority and execution authority.
Local utilization rewarding overproduction: Use measures supporting total system performance.
No ownership: Define responsibility for parameters, routes, audits, signal integrity and abnormality response.
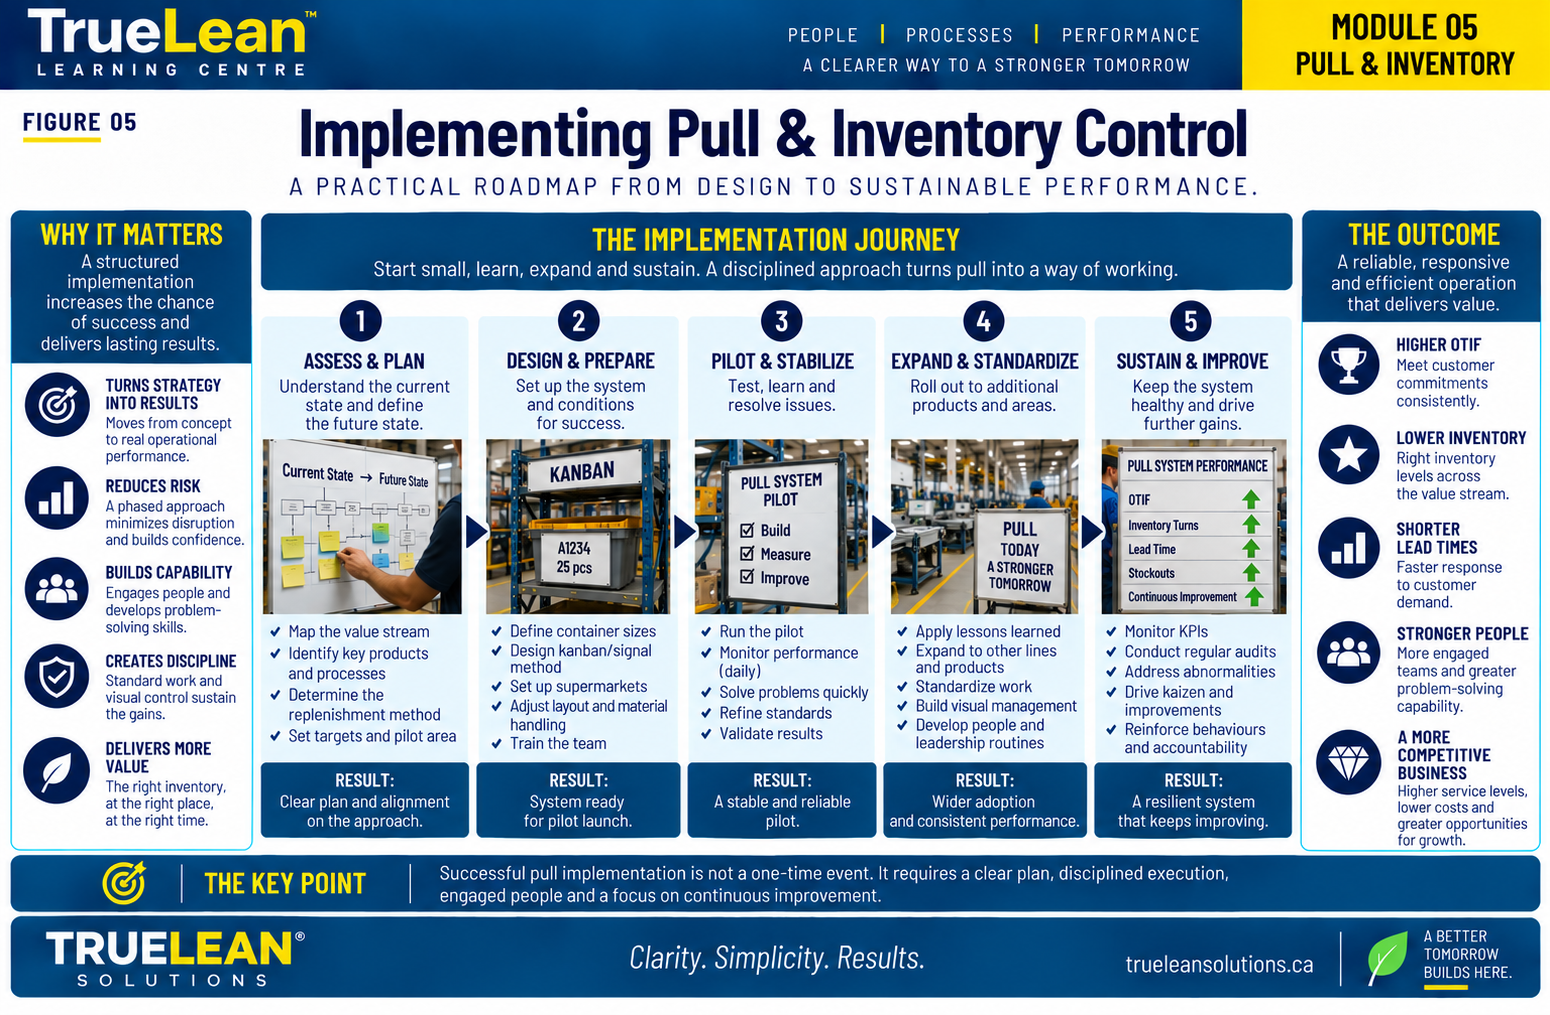
Pull is not a project that ends when the cards are printed. It is an operating system that must be managed, observed and improved.
21 · Practical Application
Consider a high-mix metal fabrication and assembly value stream: Laser Cutting → Bending → Welding → Assembly → Shipping. Average demand for a repetitive bracket family is 240 units/day with eight available production hours/day.
Current conditions include:
- Large fabrication batches.
- Bending queues.
- Variable welding performance.
- Assembly shortages.
- Approximately 600 brackets between fabrication and assembly.
- Frequent expediting.
- Weekly ERP orders released independently to multiple departments.
- 45-minute fabrication changeovers.
- No controlled supermarket.
- Production quantities increased to support machine utilization.
Demand
Existing inventory
Yet shortages still occur. This indicates that total quantity alone is not controlling availability.
Process connection
- Laser → Bending: controlled WIP while batching and changeover conditions are improved.
- Bending → Welding: FIFO with defined WIP limit.
- Welding → Assembly: supermarket pull.
The value stream deliberately uses different control methods for different operating conditions.
Initial Kanban design
The difference between the observed 600 units and calculated 70 units is a reason for investigation, not permission to immediately remove 530 units.
Improvement
- Changeover: 45 → 20 minutes.
- Replenishment lead time: 2.0 → 1.5 hours.
- Protection: 15% → 10%.
Recalculation
The inventory reduction is now supported by improved operating capability.
Practical Gemba Exercise
Select one material or product family and physically follow its replenishment loop. Observe:
Demand: Average consumption, variation and customer requirement.
Inventory: Quantity, location, purpose, coverage and ownership.
Replenishment: Trigger, frequency, elapsed lead time and expediting.
Containers: Quantity, number, ergonomics and handling implications.
Process Capability: Reliability, quality, changeovers, capacity, suppliers and schedule stability.
Control: FIFO, WIP limits, supermarkets, Kanban, signal discipline and ERP interaction.
What operating condition must improve before this inventory can be safely reduced?
TrueLean Pull & Inventory Observation & Assessment Workbook
The companion practical resource supports:
- Process & Product Family Profile
- Demand & Consumption Analysis
- Current Inventory Observation
- Inventory Purpose Classification
- Replenishment Lead-Time Study
- Container & Material-Handling Assessment
- Kanban Calculation
- FIFO & WIP-Limit Assessment
- Flow / FIFO / Supermarket Decision
- ERP/MRP & Pull Control Review
- Pacemaker & Scheduling Assessment
- Stability & Pull Readiness Assessment
- Improvement Opportunity Register
- Future-State Pull Design
- Recalculation After Improvement
- 30-60-90 Day Action Plan
Download the Pull & Inventory Assessment Workbook
Need help applying pull and inventory control to your operation?
TrueLean Solutions helps manufacturing leaders connect demand, replenishment, inventory, WIP and production-control rules into practical operating systems.
Schedule a ConsultationKey Takeaways
- Pull connects replenishment to actual consumption.
- Inventory should have a defined purpose.
- Kanban is an authorization mechanism, not simply a card or board.
- Supermarkets control inventory where direct process connection is not practical.
- FIFO requires a WIP limit to prevent uncontrolled queues.
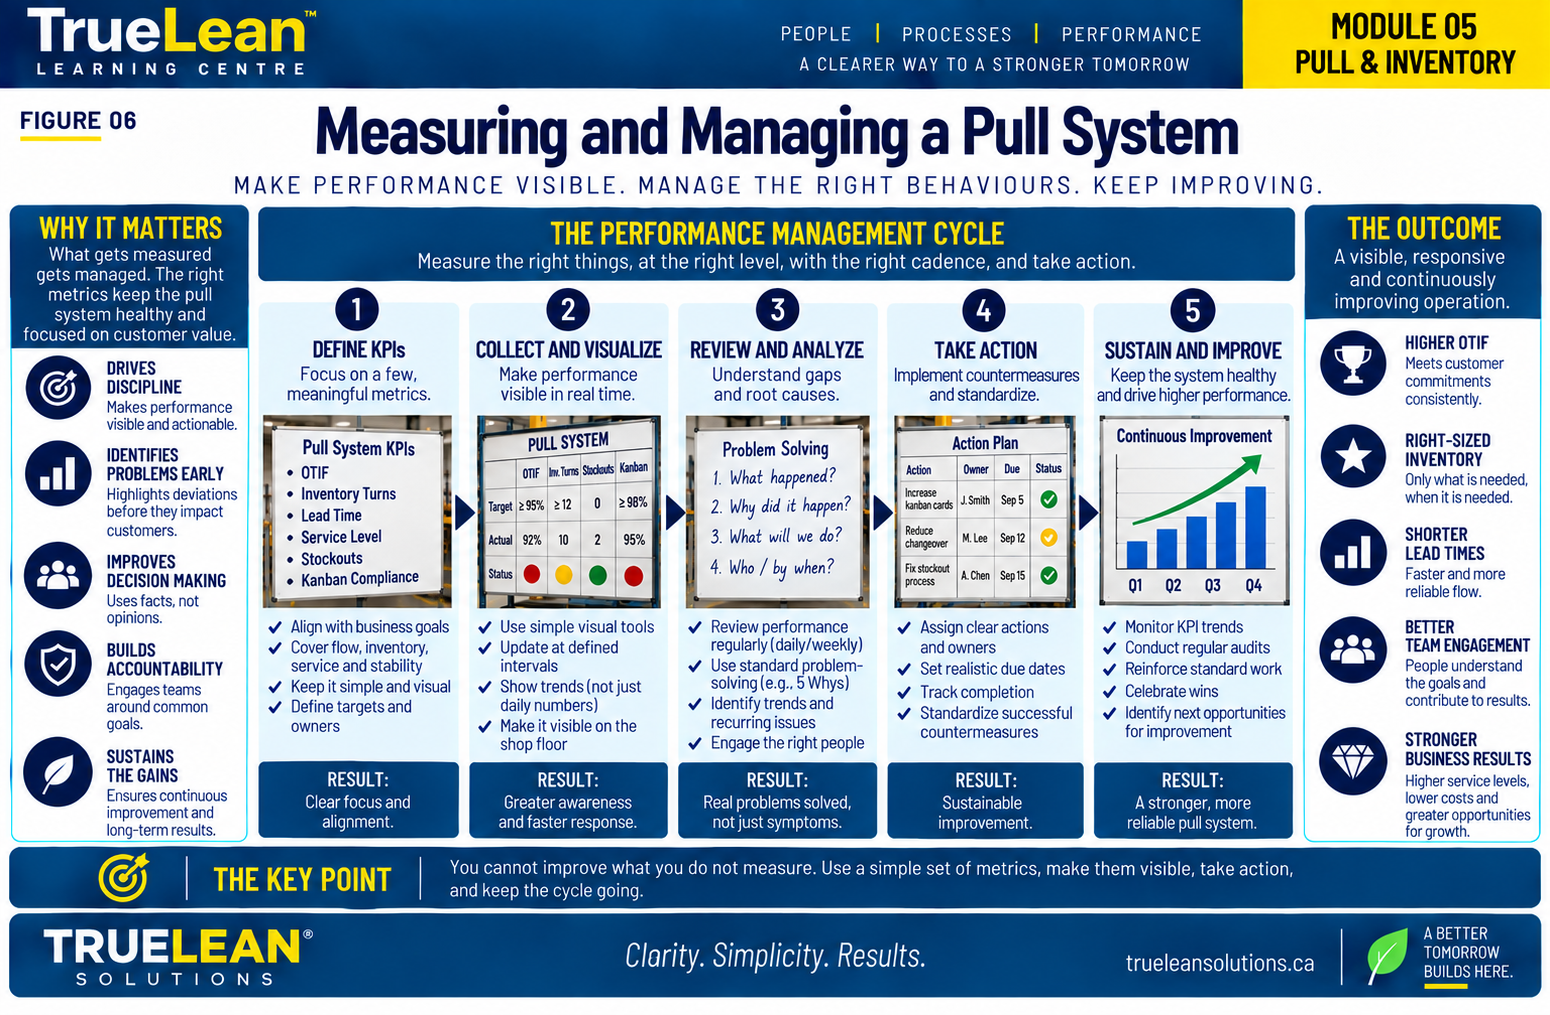
- Kanban quantities should be calculated, observed, reviewed and improved.
- Reducing replenishment lead time can reduce required inventory.
- CONWIP can provide effective WIP control in appropriate high-mix environments.
- ERP/MRP and pull can coexist when their roles are clearly defined.
- The pacemaker provides a primary production rhythm.
- Production leveling requires operating stability and capability.
- Inventory reduction should follow process improvement rather than substitute for it.
Do not simply reduce inventory. Reduce the operating conditions that make the inventory necessary.
Continue Learning
Module 06
Continue building the TrueLean Learning Centre sequence by applying the same disciplined approach to the next stage of operational improvement.
Return to Learning CentreSources & Further Reading
TPS & Pull Foundations
- Toyota Motor Corporation - Toyota Production System and Just-in-Time / Kanban reference material.
- Taiichi Ohno - Toyota Production System: Beyond Large-Scale Production.
- Shigeo Shingo - A Revolution in Manufacturing: The SMED System.
Value Stream, Pull-System Design & Lean Logistics
- Art Smalley - Creating Level Pull and related pull-system design work.
- Michel Baudin - Lean logistics and manufacturing-flow resources.
- Jeffrey K. Liker - The Toyota Way.
- Mike Rother and John Shook - Learning to See.
Operational Excellence, Measurement & Improvement
- Karen Martin - The Outstanding Organization.
- Mark Graban - Measures of Success.
- Bob Emiliani et al. - Better Thinking, Better Results.
- Paul Akers - 2 Second Lean.
- Tim Fox - A Swarm of Change.