
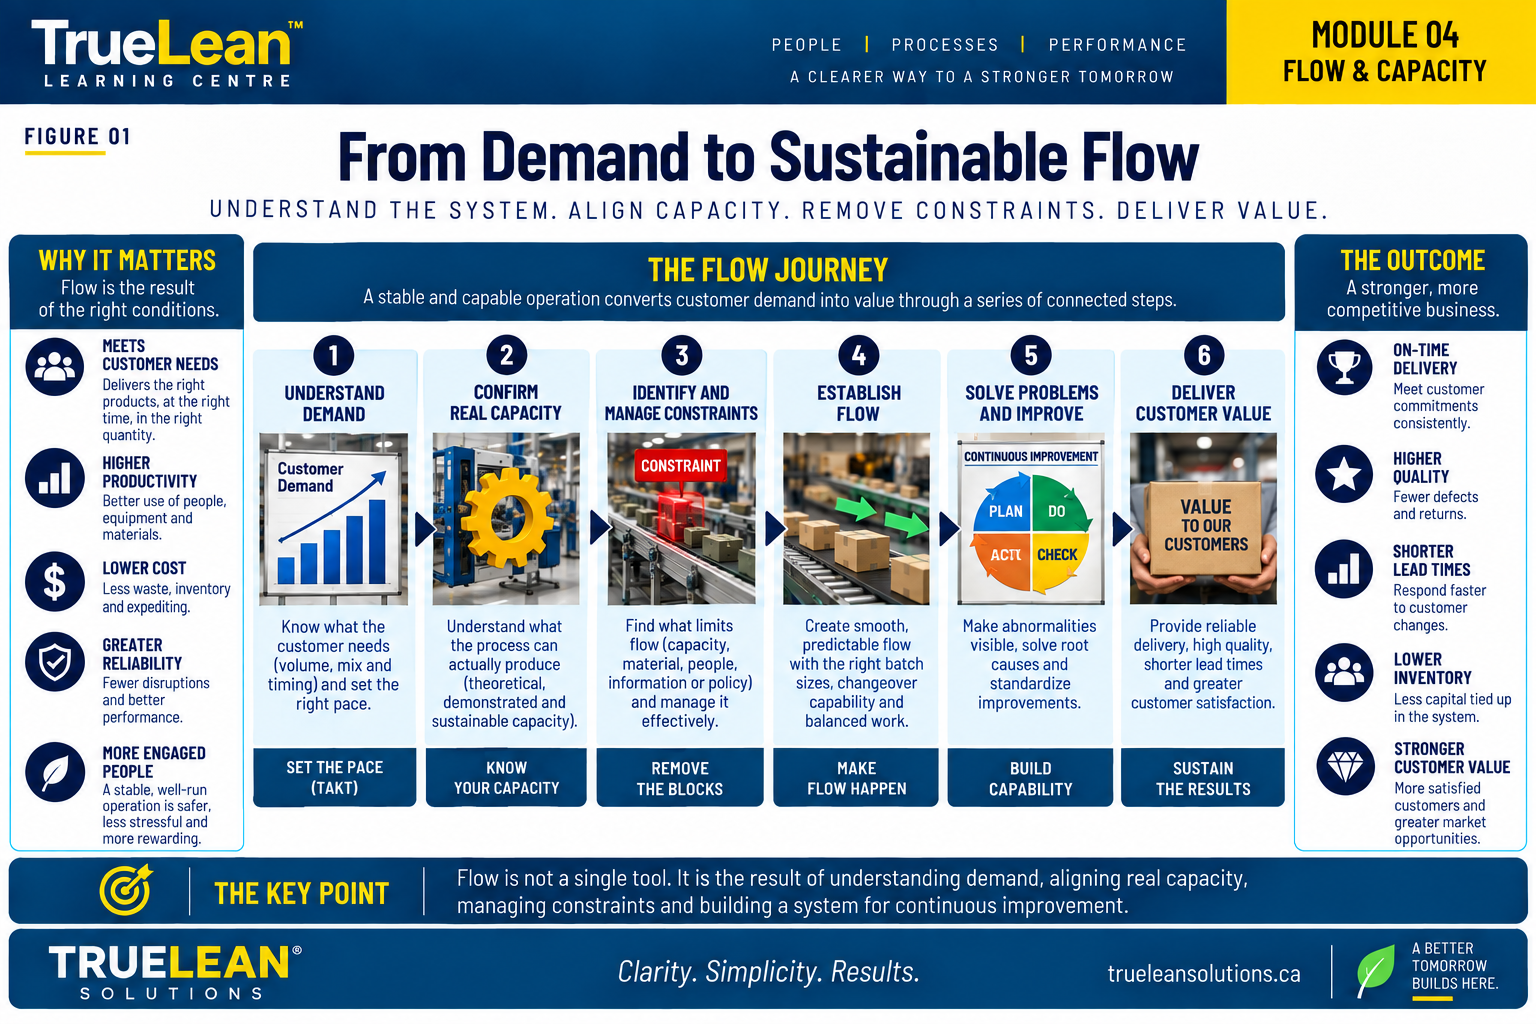
Once basic workplace stability exists, the next challenge is not simply making each operation faster. It is understanding how work moves through the entire system.
A production system can contain highly efficient machines and productive employees while still suffering from long lead times, excessive WIP, missed schedules, expediting, and poor delivery performance.
The reason is simple: local efficiency and system flow are not the same. This module examines how customer demand, takt time, cycle time, capacity, constraints, WIP, batching, changeovers, and workload balance interact to determine overall system performance.
01 · Learning Objectives
By the end of this module, you should be able to:
- Explain the difference between flow, throughput, capacity, and utilization.
- Distinguish takt time, cycle time, processing time, and lead time.
- Calculate basic takt time and process capacity.
- Identify bottlenecks and understand their effect on system throughput.
- Explain how WIP and queues influence lead time.
- Apply the basic relationship described by Little's Law.
- Explain why overproduction and large batches can disrupt flow.
- Understand how changeover reduction supports smaller batches and responsiveness.
- Recognize process imbalance and its effects.
- Evaluate capacity before recommending additional equipment or labor.
- Identify useful flow and capacity measures.
- Describe leadership's role in protecting system flow and managing constraints.
02 · Key Terms Used in This Module
The progressive movement of products, information, or work through the value stream with minimal interruption, delay, batching, or unnecessary inventory.
The rate at which a system produces completed good output over a defined period.
The maximum sustainable output a process or resource can produce under defined operating conditions.
The customer-demand rhythm calculated by dividing available production time by customer demand.
The elapsed time between completed units or cycles at a process under defined conditions. The measurement convention should be stated when the term is used.
The time during which work is actually being performed on a product or service.
The elapsed time from a defined starting point to a defined completion point.
A process or resource whose capacity is insufficient relative to the required workload.
The factor currently limiting the system's ability to achieve more of its objective. It may be physical, material, informational, policy-related, market-related, or otherwise systemic.
Material that has entered the production system but has not yet become completed output.
A controlled queue that preserves processing sequence and can limit WIP between processes.
The proportion of available resource time being used. High utilization is not automatically high system productivity.
The quantity processed or transferred together before the next product or activity begins.
The transition required to move a process from producing one product or condition to another.
A systematic approach to reducing changeover time. Historically, “single-minute” refers to single-digit minutes where technically and economically appropriate.
In this module, throughput refers primarily to the rate of completed good output through the defined production system. Theory of Constraints also uses “Throughput” as a specific management-accounting concept.
03 · Why Flow Matters
Customers experience the performance of the entire value stream, not the utilization of individual machines.
A factory can report very high utilization in Cutting, Bending, Welding, and Assembly while still carrying weeks of WIP, expediting orders, missing deliveries, and using overtime.
Maximizing every resource independently can create more material than downstream processes can consume. That material becomes inventory. Inventory creates queues. Queues increase lead time. Long lead times make the system slower to respond to changes in customer demand.
The objective is not to keep every resource busy. The objective is to create the required customer output through the system safely, reliably, with appropriate quality and as little unnecessary delay and inventory as practical.
04 · Understanding Flow as a System
Consider this simplified value stream:
If each operation independently schedules its work to maximize its own utilization, the result can be large queues between processes.
Lean asks a different question: How should the entire system operate so that customer demand moves through it reliably?
This requires understanding the relationship among:
Local Optimization vs. System Optimization
Local question: How can we make this machine produce more?
System question: What prevents the value stream from producing what the customer requires?
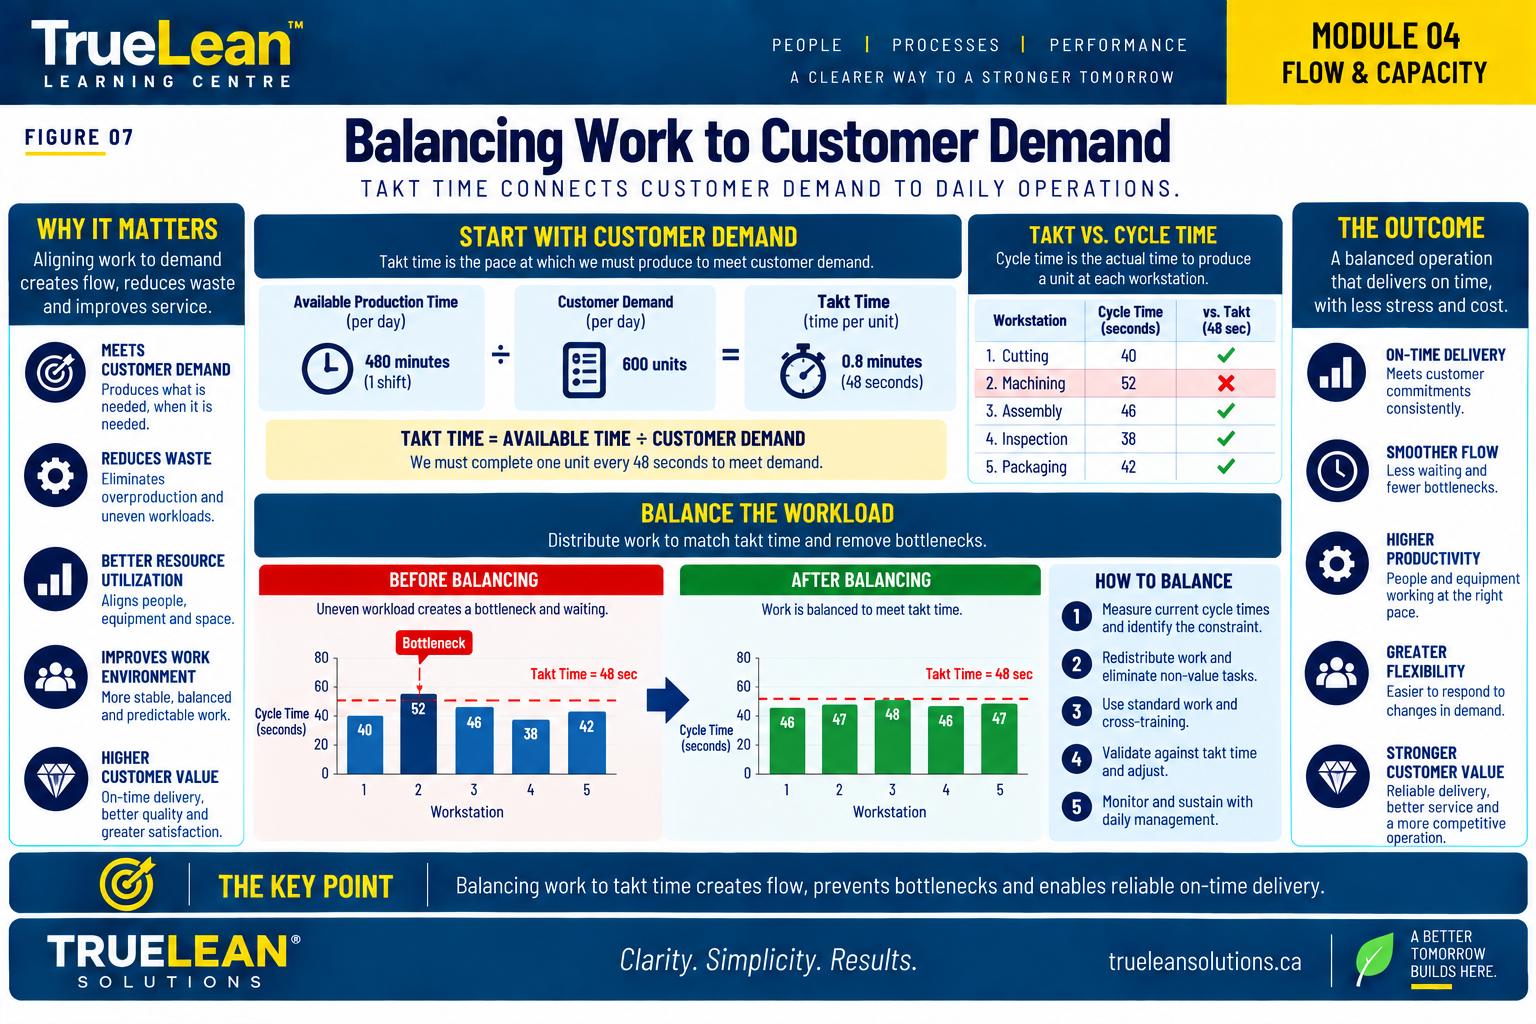
05 · Cycle Time, Lead Time and Takt Time
Takt Time
Takt is a demand reference, not the measured speed of a machine. Before calculating it, the organization should define what production time is legitimately available and consistently remove planned nonproduction periods according to its operating convention.
Example: 450 minutes of available production time ÷ 150 units of customer demand = 3 minutes/unit.
Cycle Time
If an assembly process completes one unit every 2.6 minutes, its cycle time is below the 3-minute takt reference. If it completes one unit every 3.8 minutes, it cannot meet that takt requirement as configured without changing the relevant operating conditions.
Processing Time and Lead Time
A product may require only 12 minutes of actual work while spending several days inside the factory. The difference is usually waiting, queues, movement, batching, and other elapsed time.
Takt describes required demand rhythm. Cycle time describes process output rhythm under the stated measurement convention. Processing time describes time spent actually performing work. Lead time describes total elapsed time across defined boundaries.
06 · Understanding Process Capacity
Capacity should be calculated and observed rather than assumed.
If a process has 420 available minutes/day and completes one unit every 2 minutes, theoretical capacity is 210 units/day.
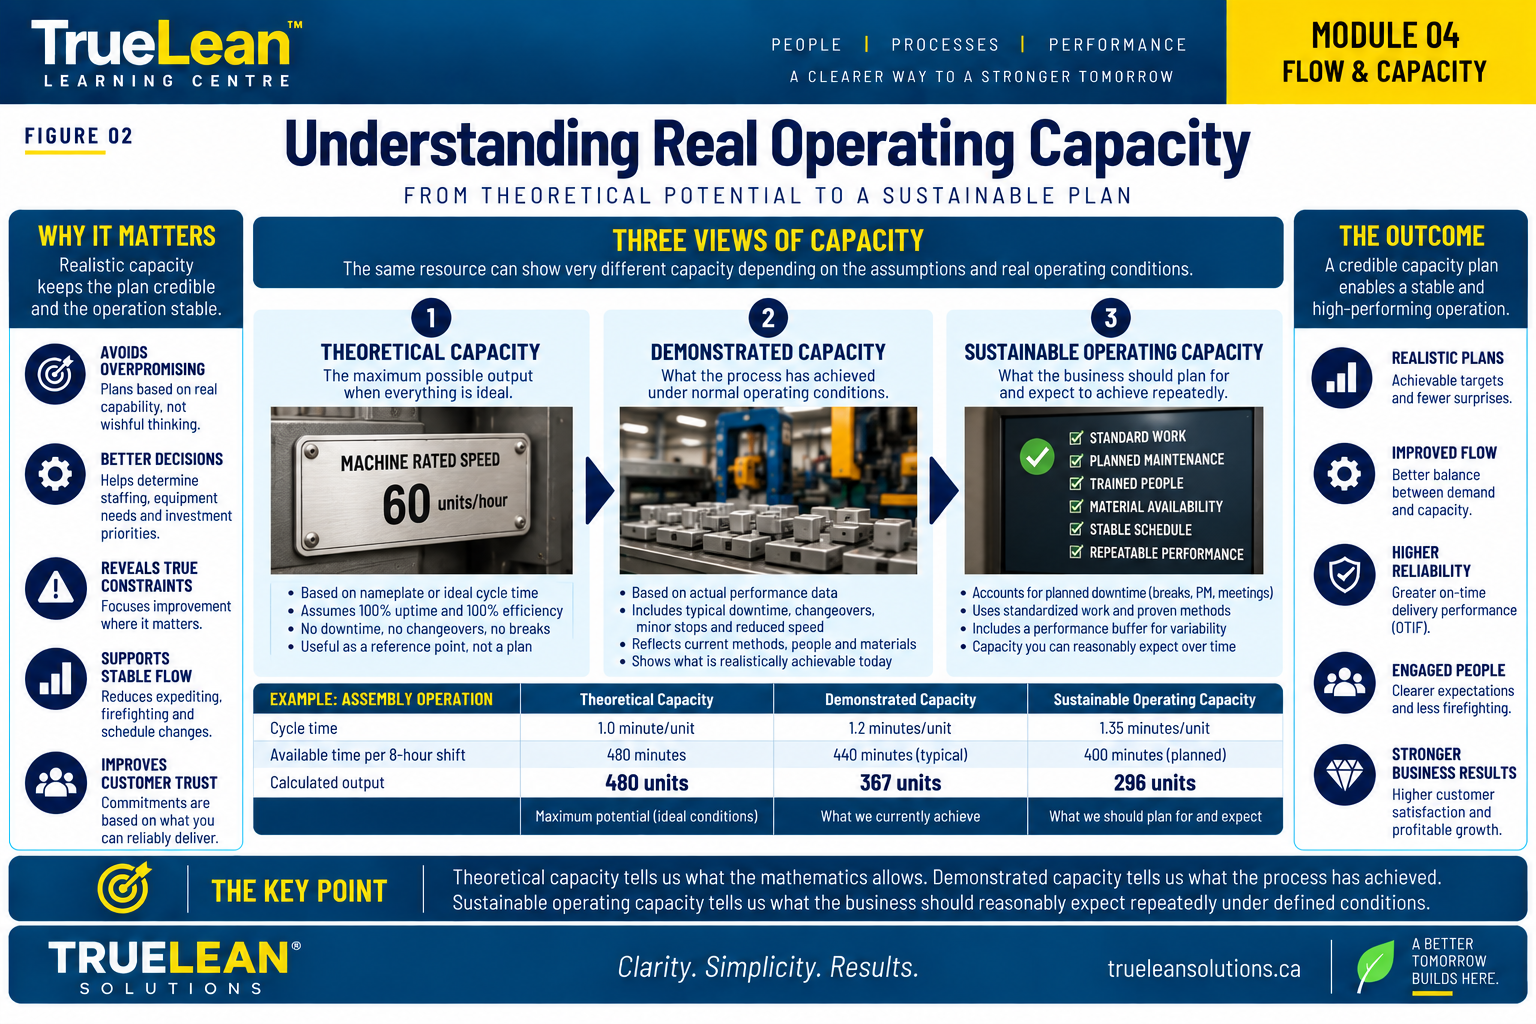
Three Useful Ways to Think About Capacity
Capacity is not a single number. Leaders should understand the difference between what a process could produce mathematically, what it has actually demonstrated, and what it can reliably sustain.
Theoretical Capacity
The calculated maximum output assuming the process operates continuously at its defined cycle time during all available production time. It is useful for understanding the upper limit under the stated assumptions, but it does not account for real operating losses.
Demonstrated Capacity
The output the process has actually shown it can achieve under real operating conditions. A strong historical day provides evidence of capability, but one exceptional day should not automatically become the planning standard because it may reflect favorable product mix, experienced operators, few changeovers, no major breakdowns, or unusually good material availability.
Sustainable Operating Capacity
The output the process can reasonably and repeatedly deliver while maintaining required safety, quality, equipment condition, staffing, product mix, maintenance, and normal operating requirements.
For example, a process may have a theoretical capacity of 210 units/day, a demonstrated capacity of 185 units/day, and a sustainable operating capacity of 170 units/day.
The difference between theoretical and sustainable capacity is not automatically waste. Some time is legitimately consumed by planned maintenance, changeovers, inspections, breaks, cleaning, and required process controls. Other losses may represent improvement opportunities.
Theoretical capacity tells us what the mathematics allows. Demonstrated capacity tells us what the process has achieved. Sustainable operating capacity tells us what the business should reasonably expect the process to deliver repeatedly under defined conditions.
Theoretical, demonstrated, and sustainable operating capacity are used here as a TrueLean instructional framework for capacity analysis; they should not be interpreted as formal Toyota Production System terminology.
07 · Bottlenecks and Constraints
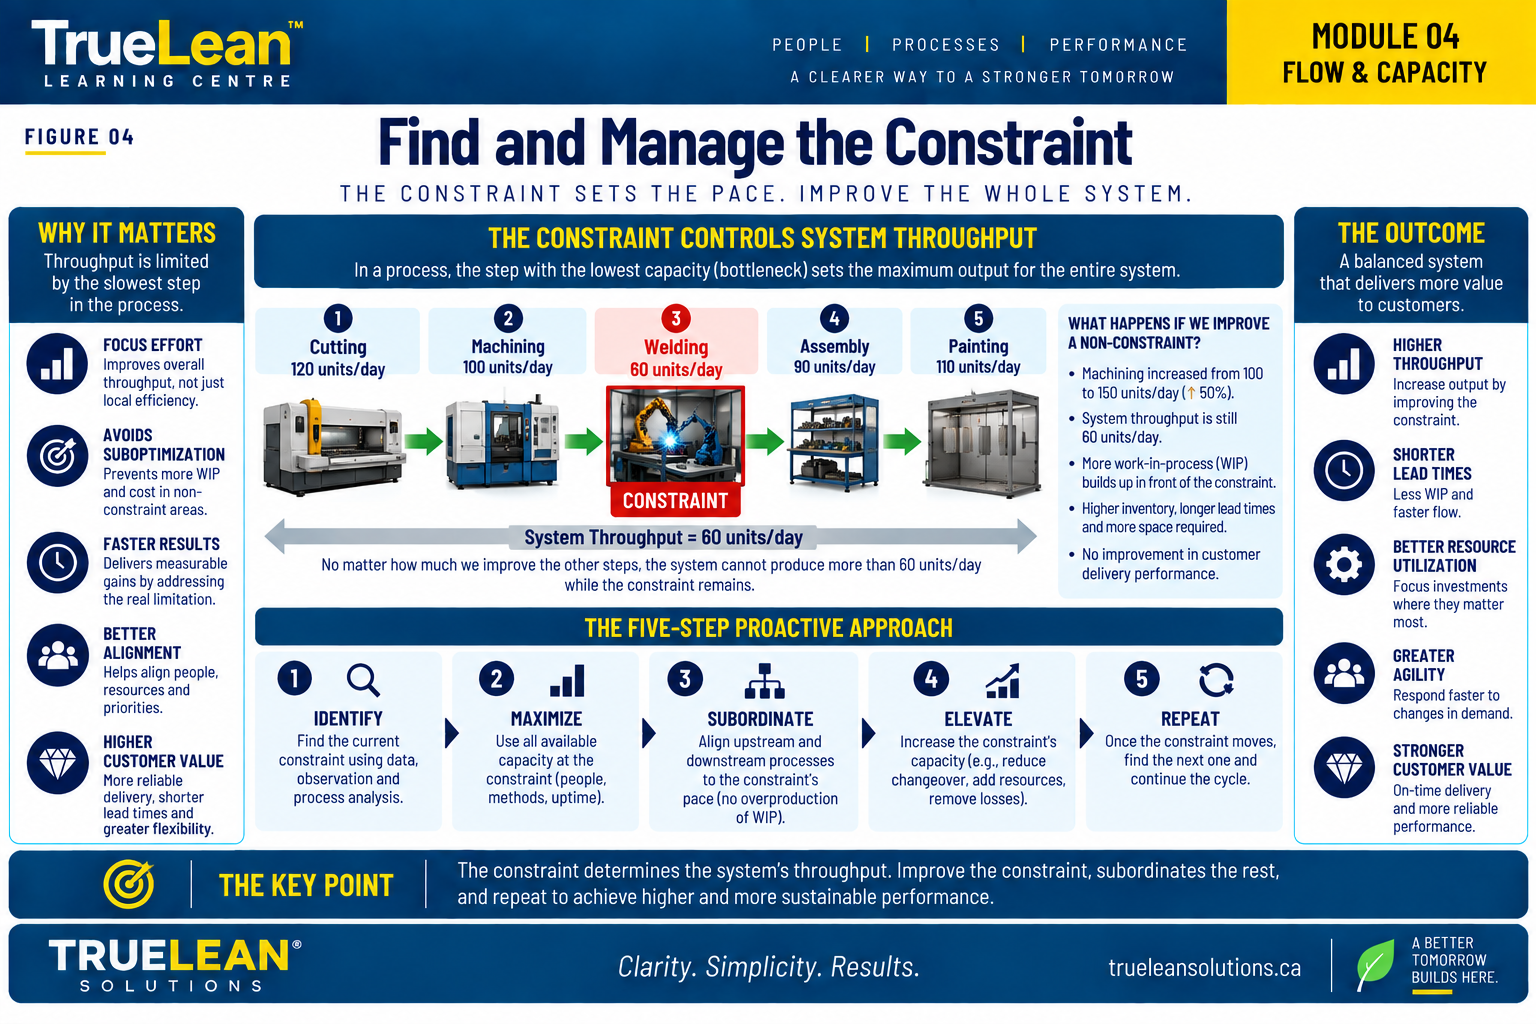
Consider four sequential operations with sustainable capacities of Cutting 600/day, Bending 500/day, Welding 320/day, and Assembly 450/day.
If every product requires every operation and no other condition is limiting, Welding is the apparent capacity bottleneck and, under the stated assumptions, the current physical constraint.
Increasing Cutting from 600 to 700 units/day does not increase system throughput. It primarily increases the opportunity to build WIP before Welding.
Protect the Constraint
- Prevent the constraint from waiting for material, instructions, or approvals.
- Reduce avoidable quality losses and rework at the constraint.
- Reduce changeover and minor-stop losses where practical.
- Ensure appropriate preventive maintenance and basic equipment conditions.
- Sequence work so the constraint processes what the system actually needs.
- Move nonessential work away from the constraint where feasible.
- Control upstream production so it does not simply flood the constraint with WIP.
Do not add capacity until you understand what is consuming the capacity you already have.
08 · WIP, Queues and Little's Law
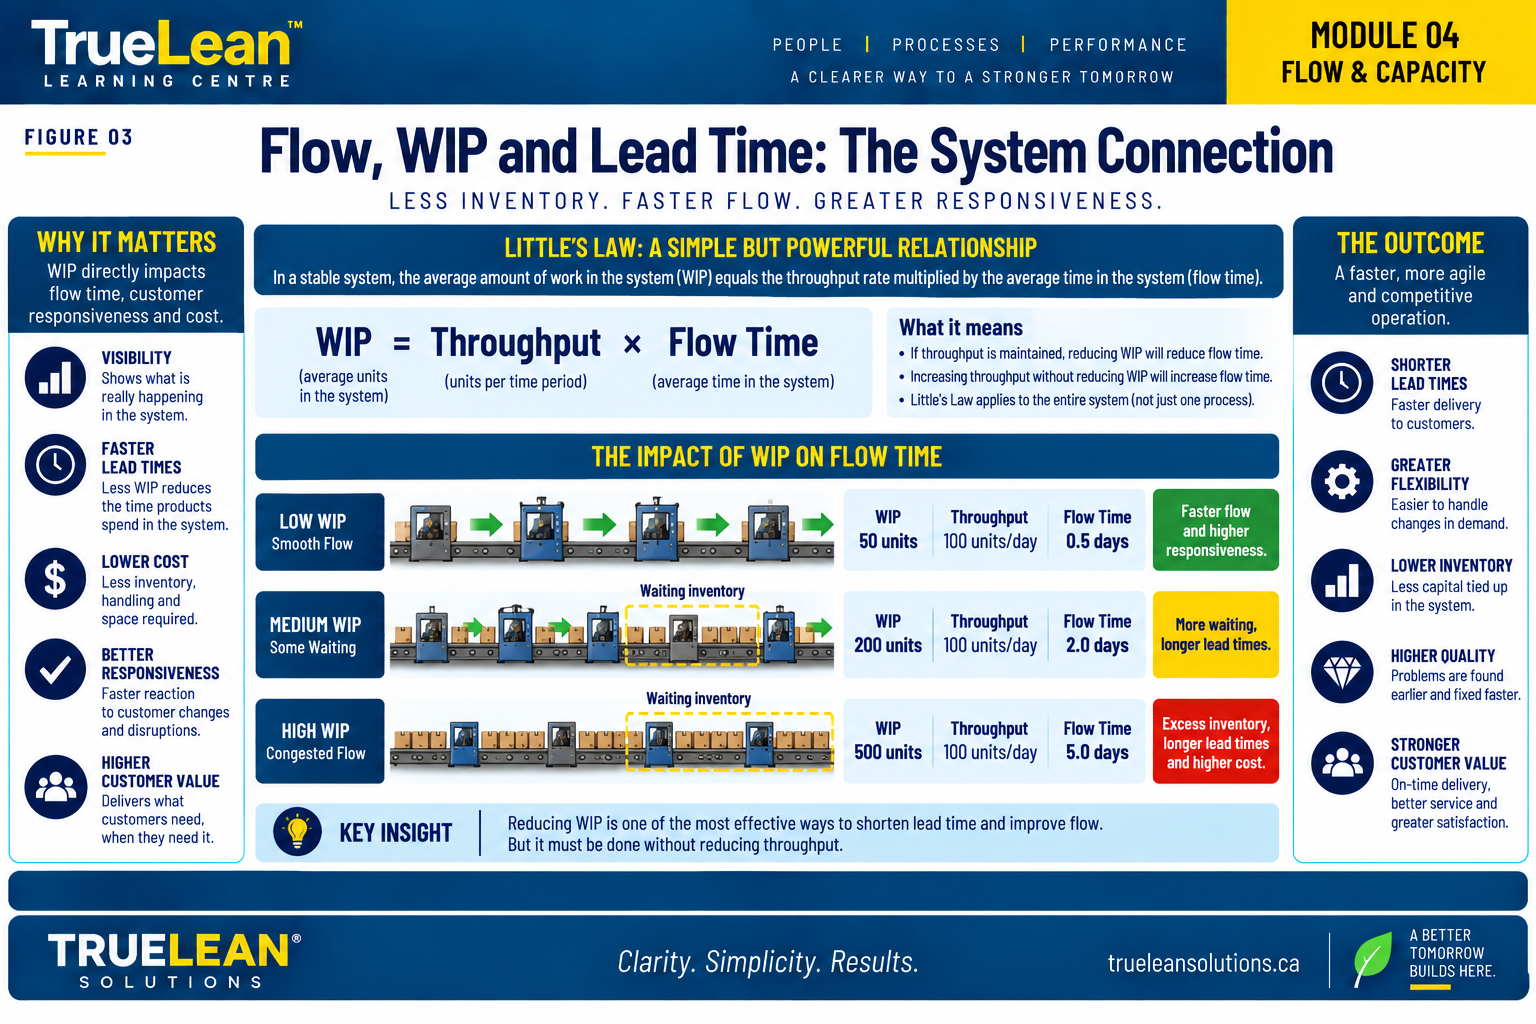
Some WIP can be necessary because processes may be physically separated, decoupled, subject to variation, or unable to operate in true one-piece flow.
But uncontrolled WIP can:
- Increase lead time.
- Consume floor space.
- Hide defects.
- Complicate prioritization.
- Increase handling.
- Delay feedback.
- Obscure shortages.
- Make schedule changes harder.
WIP = Throughput × Flow Time
Flow Time = WIP ÷ Throughput
If a stable system averages 600 units of WIP and completes 100 units/day, average flow time through the defined system is approximately 6 days. If WIP falls to 300 units while throughput remains 100 units/day, average flow time is approximately 3 days.
Little's Law is a long-run average relationship for a stable system using consistent system boundaries and units. It does not prove that simply removing inventory will preserve throughput.
If instability, starvation, blocking, or shortages are not addressed, indiscriminate WIP reduction can damage performance.
The objective is controlled WIP, not arbitrarily low WIP.
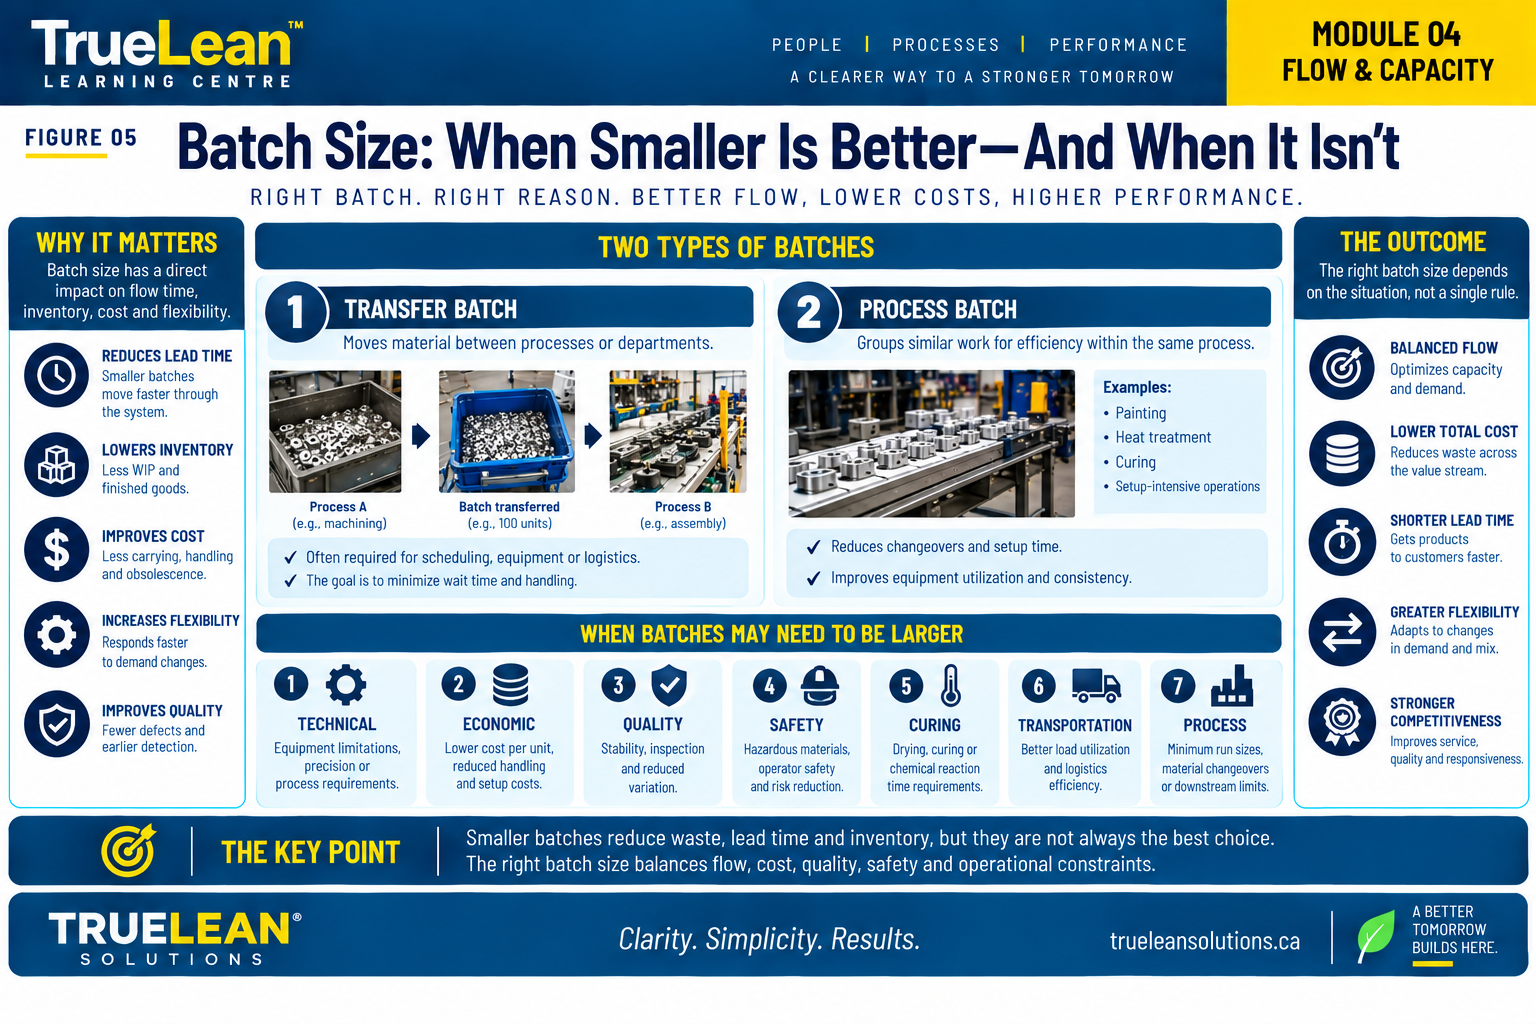
09 · Why Overproduction and Batching Disrupt Flow
A machine may appear efficient when it produces a large batch, but the system question is whether the downstream process needs that material now.
Producing 500 units at once when demand is 50 units/day can create ten days of output from that process before considering other inventory.
Large batches can create:
- Excess WIP.
- Longer queues.
- Delayed defect discovery.
- Reduced flexibility.
- More handling and storage.
- Greater schedule complexity.
- Longer lead time.
When Batching May Be Necessary
Lean generally seeks smaller batches and continuous flow where practical, but one-piece flow is not technically, economically, or operationally appropriate for every process.
Technical Constraints
Equipment such as heat-treatment furnaces, industrial ovens, batch mixers, coating systems, and some washing processes may inherently process multiple units together.
Economic Constraints
Setup, startup, energy, tooling, or material costs can make extremely small quantities disproportionately expensive. Lean should challenge and reduce those costs rather than automatically accepting very large batches.
Quality Requirements
Products may need to be processed, inspected, tested, or released as controlled lots for traceability or specified quality requirements.
Safety Requirements
Safe procedures may require defined loading, isolation, heating, cooling, cleaning, depressurization, or other batch conditions. Flow improvement must never compromise safety.
Curing or Processing Requirements
Paint, adhesives, coatings, heat treatment, chemical reactions, drying, or sterilization may require controlled residence time and batch movement.
Transportation Constraints
Movement between buildings, plants, suppliers, or distant operations can create practical transfer quantities through trucks, containers, racks, pallets, or material-handling systems.
Process Constraints
Some furnaces, washers, plating lines, mixers, or coating systems have practical minimum or maximum loads that prevent true one-piece processing.
One-piece flow is an ideal condition where it is practical—not a rule that should be imposed regardless of process reality.
Ask why the batch exists and what is the smallest practical batch that supports safe, reliable, high-quality, and economically responsible flow.
10 · Changeovers and SMED
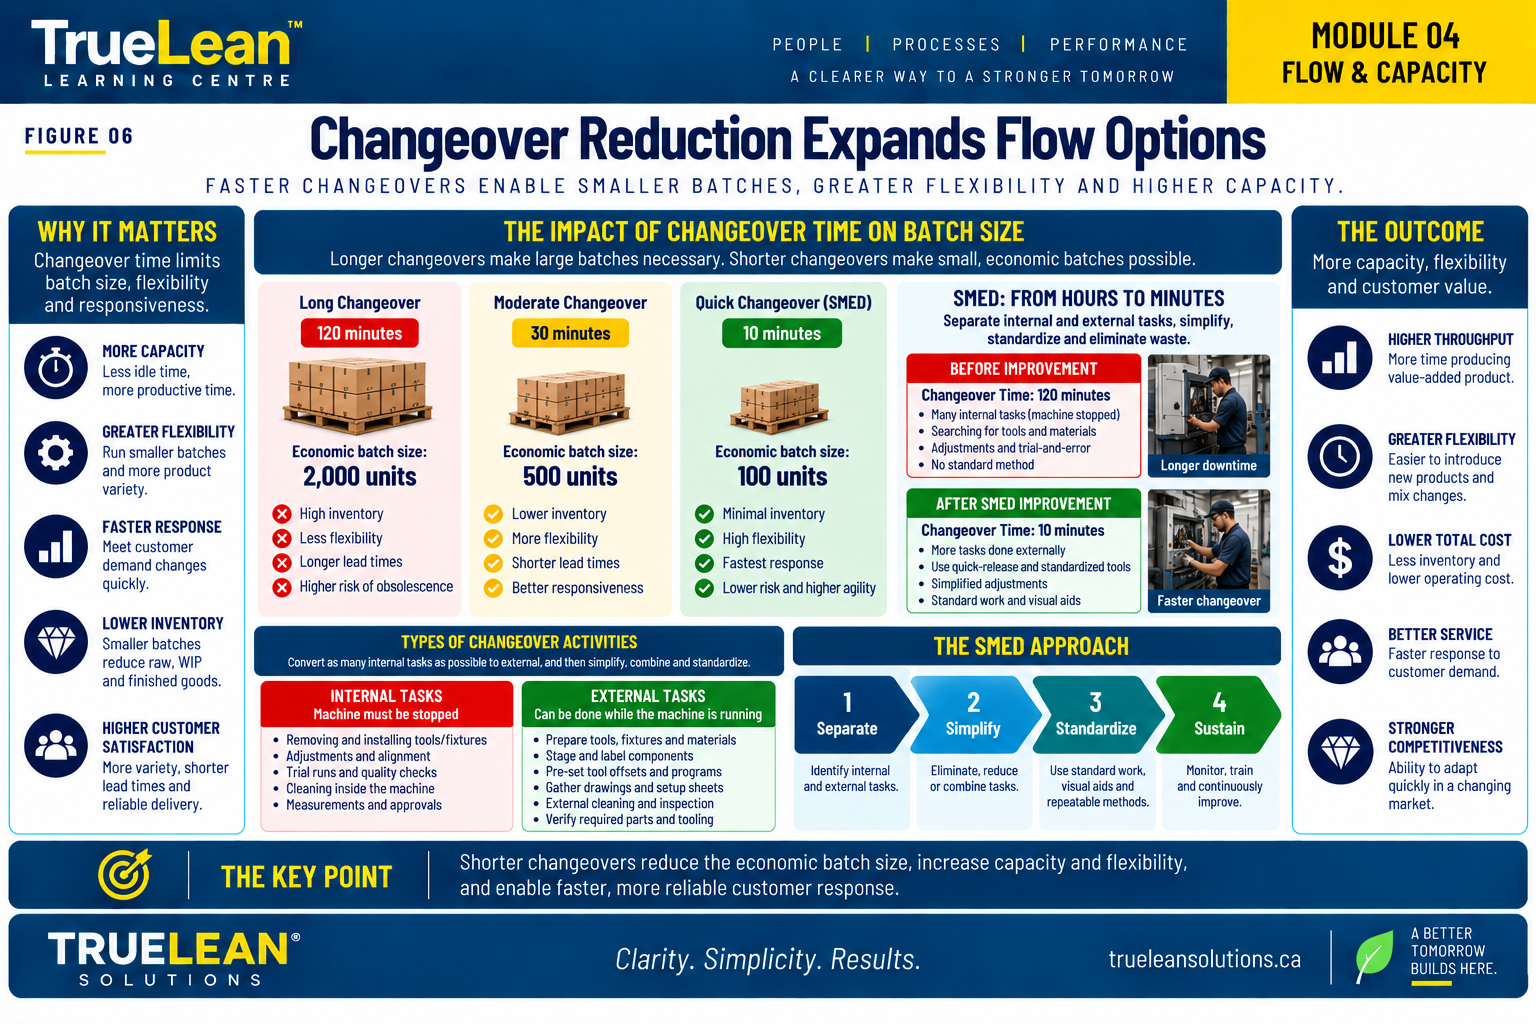
Large batches often exist because changeovers take too long. If a machine requires 90 minutes to change products, managers naturally try to reduce the number of changeovers. The result is often larger batches.
SMED attacks the cause rather than accepting the consequence.
- Observe and document the actual changeover.
- Separate internal and external activities.
- Perform as much preparation as practical while the equipment is still operating.
- Convert internal activities to external where feasible.
- Simplify and streamline remaining internal work.
- Standardize the improved method.
- Continue improving.
If a changeover falls from 90 minutes to 20 minutes, smaller batches may become practical. The benefit is not merely more machine time; the change can alter how the entire production system is scheduled and flowed.
11 · Process Balance and Workload Distribution
Consider a four-station line with a takt requirement of 60 seconds/unit.
| Station | Work Content |
|---|---|
| A | 42 sec |
| B | 58 sec |
| C | 76 sec |
| D | 44 sec |
Average work content is 55 seconds, but Station C still exceeds the 60-second takt. The average hides the imbalance.
Possible countermeasures might include:
- Redistributing work.
- Changing sequence.
- Eliminating waste.
- Improving method.
- Modifying tooling.
- Reducing walking.
- Combining or separating tasks.
- Cross-training.
- Changing staffing configuration.
The goal is not necessarily to make every station numerically identical. It is to create a practical workload arrangement that supports required flow while respecting safety, quality, technical constraints, and variation.
12 · Manufacturing Example — Finding the Real Constraint
A fabricated-products operation is missing its daily requirement of 300 units/day. Management proposes purchasing another cutting machine because Cutting frequently has a queue.
| Process | Observed Sustainable Capacity |
|---|---|
| Cutting | 520/day |
| Forming | 430/day |
| Welding | 285/day |
| Coating | 360/day |
| Assembly | 340/day |
The capacity profile suggests Welding, not Cutting, is the current physical bottleneck under these assumptions.
Gemba observation at Welding identifies:
- 35 minutes/day waiting for material.
- 25 minutes/day searching for fixtures.
- 40 minutes/day of changeover.
- 20 minutes/day addressing upstream quality issues.
Total identified interruption: 120 minutes/day.
How much of the existing Welding capacity can be recovered by addressing the observed losses before capital is added?
If those losses are reduced substantially, the system may meet the 300-unit requirement without additional capital—or the constraint may move somewhere else.
13 · Observe the Flow Before Adding Capacity
When demand exceeds output, the natural response is often to add people, overtime, machines, shifts, or outsourcing. Sometimes those actions are necessary.
But first observe the flow:
- Where does work wait?
- Where does WIP accumulate?
- Which process repeatedly starves?
- Which process repeatedly blocks?
- Where do defects originate?
- Where are changeovers longest?
- Which operations regularly exceed takt?
- What is the actual product mix?
- What work is being expedited?
- What resources are producing ahead?
- What interrupts the constraint?
- What percentage of available time actually creates required output?
A capacity problem should be demonstrated with evidence before capital is committed.
14 · Common Flow & Capacity Mistakes
Maximizing Every Machine
High utilization everywhere can generate overproduction and queues.
Confusing Takt with Cycle Time
Takt comes from customer demand. Cycle time comes from the process.
Managing Average Capacity Only
Averages can hide product-mix effects, variability, downtime, changeovers, and bottlenecks.
Adding Equipment Before Recovering Existing Capacity
Capital can mask process losses rather than solve them.
Running Large Batches Because Changeovers Are Long
This treats the symptom rather than improving the setup process.
Reducing WIP Without Stabilizing the System
Removing inventory without addressing instability can expose shortages faster without solving them.
Balancing to Average Work Content
Averages can hide individual operations that exceed takt.
Improving a Nonconstraint and Calling It Productivity
Producing more material that cannot move through the system is not necessarily system improvement.
Treating the Bottleneck as Permanent
Constraints can move as demand, mix, equipment performance, staffing, and process conditions change.
15 · Measure What Matters
A useful flow-and-capacity management system should combine several measures.
| Dimension | Example Measures |
|---|---|
| Customer Demand | Demand/day, takt time |
| Flow | Lead time, flow time, queue time |
| Throughput | Good units/hour or day |
| WIP | Units or days of WIP by process |
| Capacity | Sustainable output by process |
| Constraint | Constraint utilization, lost constraint time |
| Balance | Cycle time vs. takt by operation |
| Changeover | Setup duration and frequency |
| Reliability | Downtime, minor stops, availability |
| Quality | FPY, scrap, rework |
| Delivery | Schedule attainment, OTIF/OTD |
Are we meeting demand? If not, where is flow being interrupted and why?
High utilization is not automatically high productivity. A resource producing material the system does not currently need may be highly utilized while reducing overall flow performance.
16 · Leadership Responsibilities
Flow is strongly influenced by management decisions: batch policies, scheduling priorities, staffing, overtime, inventory rules, capital allocation, maintenance priorities, production targets, escalation rules, and performance measures.
Leadership should:
- Manage the value stream rather than isolated departments.
- Protect constraint capacity.
- Challenge unnecessary batching.
- Make WIP visible.
- Distinguish activity from throughput.
- Resolve recurring causes of interruption.
- Align measures with customer and system performance.
People generally respond to the operating system and measures leadership creates. If the system rewards local output, local output is what the organization will optimize.
17 · Applying the TrueLean Improvement Framework
Assess: Map actual flow. Measure demand, cycle times, processing time, WIP, queues, changeovers, downtime, capacity, quality losses, and throughput. Identify the current constraint.
Plan: Define required customer output, takt reference, target flow, appropriate WIP controls, constraint protection, workload changes, changeover priorities, and measures.
Implement: Introduce practical countermeasures such as workload redistribution, FIFO controls, point-of-use material, smaller batches, improved scheduling, SMED, standardized work, visual controls, or constraint-focused maintenance.
Improve: Measure again. Did throughput improve? Did WIP and lead time improve? Did the constraint move? Did quality remain stable? Did the change create new problems?
Sustain: Embed the improved system into daily management, standardized work, production planning, leader standard work, capacity reviews, visual management, maintenance, and continuous improvement.
ASSESS → PLAN → IMPLEMENT → IMPROVE → SUSTAIN
18 · Key Takeaways
- Flow is a system property. Optimizing individual resources does not guarantee system improvement.
- Takt comes from demand. It is not the same as cycle time.
- Capacity must be understood under defined operating conditions.
- The active constraint governs system throughput when it is the limiting factor.
- WIP and lead time are connected; more inventory usually means more time in the system when throughput is unchanged.
- Large batches often compensate for long changeovers.
- SMED can enable smaller batches and greater responsiveness.
- Average workload can hide imbalance.
- Adding capacity should follow evidence, not assumption.
- Leadership measures influence operating behavior.
Improve the flow of the system—not simply the speed or utilization of its individual parts.
19 · Practical Resource
TrueLean Flow & Capacity Observation & Assessment Workbook
Take this module to the Gemba with a practical workbook designed to help teams capture actual demand, cycle times, WIP, changeovers, capacity, constraint losses, batch conditions, and improvement opportunities using one structured observation process.
The workbook includes:
- Process and demand profiling.
- Process observation chart.
- Theoretical, demonstrated, and sustainable capacity analysis.
- Flow and constraint review.
- Constraint lost-time logging.
- Batch and changeover analysis.
- Flow performance summary.
- Takt-versus-cycle-time review.
- Improvement opportunity prioritization.
- 30-day action plan using the TrueLean framework.
Download the Flow & Capacity Workbook
Need help applying this to your operation?
TrueLean Solutions helps manufacturing leaders assess flow and capacity, identify the constraints that matter most, and build practical improvement roadmaps based on evidence.
Schedule a Consultation20 · Continue Learning
Module 05 — Pull & Inventory
Once flow and capacity are understood, the next question becomes: How should production and replenishment be triggered when continuous flow is not practical?
Module 05 will examine Pull Systems, Kanban, Supermarkets, FIFO, Replenishment, Inventory, Safety Stock, and Production Control.
Return to Learning Centre21 · Sources & Further Reading
The references below combine foundational Lean/TPS works, operations science, applied manufacturing resources, management and transformation perspectives, and contemporary research for readers who want to explore the subject in greater depth.
Foundational Lean/TPS
- Toyota Motor Corporation — Toyota Production System
- Taiichi Ohno — Toyota Production System: Beyond Large-Scale Production
- Shigeo Shingo — A Revolution in Manufacturing: The SMED System
Operations & Flow Science
- John D. C. Little — “A Proof for the Queuing Formula: L = λW”
- Wallace J. Hopp & Mark L. Spearman — Factory Physics
- Eliyahu M. Goldratt & Jeff Cox — The Goal
Applied Manufacturing & Process Improvement
- NIST Manufacturing Extension Partnership — Lean and Process Improvement
- ASQ — Process Capability and Quality Resources
Lean Transformation & Management Systems
- Karen Martin — The Outstanding Organization
- Mark DeLuzio — Turn Waste into Wealth
- Michael Ballé and collaborators — The Lean Strategy
- Bob Emiliani et al. — Better Thinking, Better Results
- Mike Rother & John Shook — Learning to See
- Jeffrey K. Liker — The Toyota Way
Measurement, Leadership & Organizational Learning
- Mark Graban — Measures of Success
- W. Edwards Deming — Systems, Variation and Management Thinking
- Edgar Schein — Organizational Culture and Leadership
- Amy Edmondson — Psychological Safety and Organizational Learning
- Peter Senge — The Fifth Discipline
Contemporary Research & Emerging Operations
Selected peer-reviewed research in manufacturing systems and operations management can extend these foundations into digital Lean, ERP-enabled operations, AI and analytics, Industry 4.0/5.0, smart manufacturing, human-machine systems, sustainability, and resilient supply chains where those topics materially strengthen the underlying operational problem.